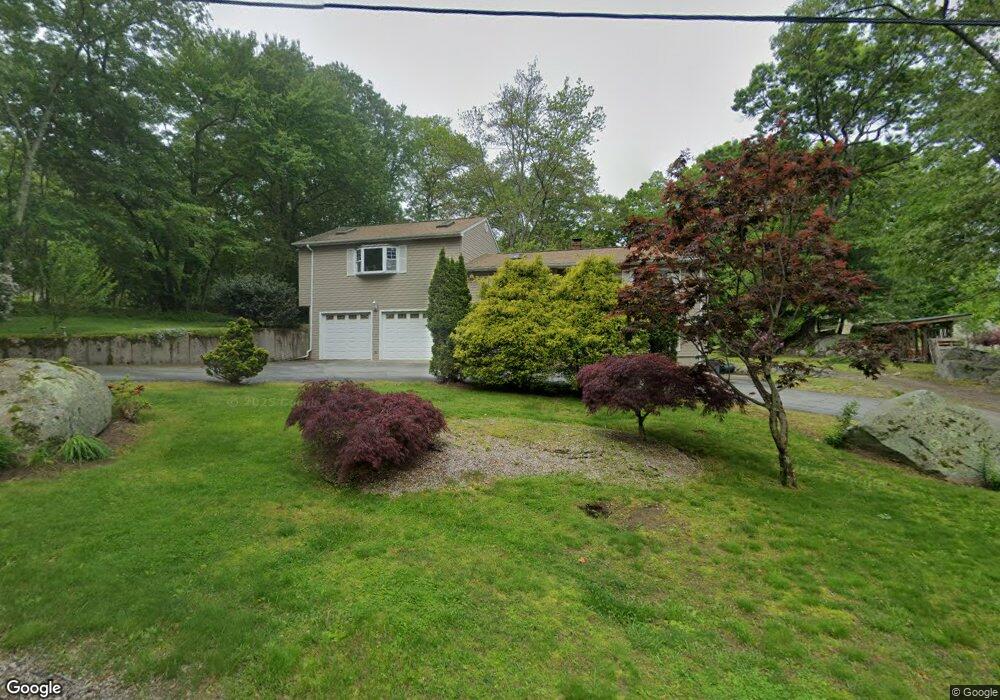
7 Cady St Johnston, RI 02919
Graniteville NeighborhoodEstimated Value: $483,000 - $537,000
3
Beds
2
Baths
1,600
Sq Ft
$312/Sq Ft
Est. Value
About This Home
This home is located at 7 Cady St, Johnston, RI 02919 and is currently estimated at $499,165, approximately $311 per square foot. 7 Cady St is a home located in Providence County with nearby schools including Johnston Senior High School, St. Thomas Regional School, and Overbrook Academy.
Ownership History
Date
Name
Owned For
Owner Type
Purchase Details
Closed on
Apr 29, 2019
Sold by
Pelland Normand E
Bought by
Pelland Normand E and Pelland Elaine A
Current Estimated Value
Home Financials for this Owner
Home Financials are based on the most recent Mortgage that was taken out on this home.
Original Mortgage
$134,000
Outstanding Balance
$82,269
Interest Rate
3.5%
Mortgage Type
New Conventional
Estimated Equity
$416,896
Purchase Details
Closed on
Apr 24, 2019
Sold by
Pelland Normand E and Pelland Elaine E
Bought by
Pelland Normand E
Home Financials for this Owner
Home Financials are based on the most recent Mortgage that was taken out on this home.
Original Mortgage
$134,000
Outstanding Balance
$82,269
Interest Rate
3.5%
Mortgage Type
New Conventional
Estimated Equity
$416,896
Create a Home Valuation Report for This Property
The Home Valuation Report is an in-depth analysis detailing your home's value as well as a comparison with similar homes in the area
Home Values in the Area
Average Home Value in this Area
Purchase History
We collect this data history from publicly available records. To have your information removed, we recommend requesting removal directly through your county’s website.
| Date | Buyer | Sale Price | Title Company |
|---|---|---|---|
| Pelland Normand E | -- | -- | |
| Pelland Normand E | -- | -- | |
| Pelland Normand E | -- | -- | |
| Pelland Normand E | -- | -- | |
| Pelland Normand E | -- | -- |
Source: Public Records
Mortgage History
We collect this data history from publicly available records. To have your information removed, we recommend requesting removal directly through your county’s website.
| Date | Status | Borrower | Loan Amount |
|---|---|---|---|
| Open | Pelland Normand E | $134,000 | |
| Closed | Pelland Normand E | $134,000 |
Source: Public Records
Tax History
| Year | Tax Paid | Tax Assessment Tax Assessment Total Assessment is a certain percentage of the fair market value that is determined by local assessors to be the total taxable value of land and additions on the property. | Land | Improvement |
|---|---|---|---|---|
| 2025 | $6,982 | $447,000 | $102,400 | $344,600 |
| 2024 | $6,839 | $447,000 | $102,400 | $344,600 |
| 2023 | $6,839 | $447,000 | $102,400 | $344,600 |
| 2022 | $4,029 | $272,900 | $75,800 | $197,100 |
| 2021 | $6,342 | $272,900 | $75,800 | $197,100 |
| 2018 | $6,477 | $235,600 | $56,400 | $179,200 |
| 2016 | $8,569 | $235,600 | $56,400 | $179,200 |
| 2015 | $6,094 | $210,200 | $57,000 | $153,200 |
| 2014 | $4,692 | $210,200 | $57,000 | $153,200 |
| 2013 | $6,043 | $210,200 | $57,000 | $153,200 |
Source: Public Records
Map
Nearby Homes
- 9 Anglewood Ave
- 0 Anglewood Ave
- 158 Scenery Ln
- 16 Elizabeth Ave
- 74 Anglewood Ave
- 18 Adelaide Ave
- 45 Riverside Ave
- 58 Alfred Ave
- 32 Cottage St
- 63 Esmond St Unit A
- 2 A Old County Village Way Unit A
- 2 A Old County Village Way Unit B
- 2 Adams Ln Unit C
- 253 Waterman Ave
- 3 Nelson St
- 41 Esmond St
- 154 Waterman Ave Unit 156
- 18 Carriage Way
- 5 Maple Ave
- 5 Lacey Ct
Your Personal Tour Guide
Ask me questions while you tour the home.