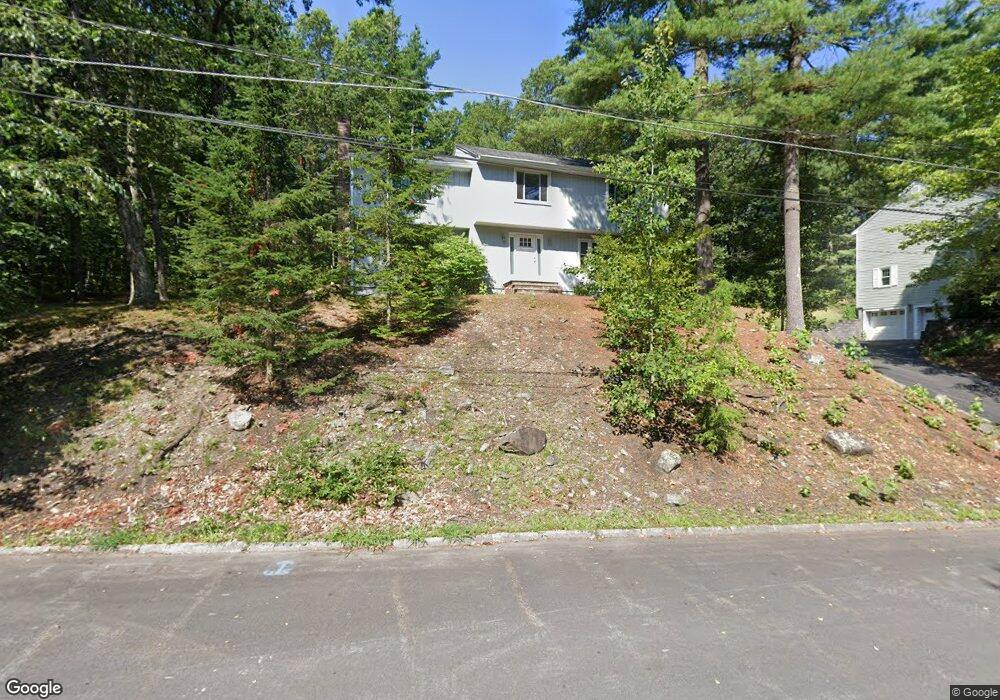
7 Christian Dr Unit 1 Nashua, NH 03063
Northwest Nashua NeighborhoodEstimated Value: $576,000 - $677,000
4
Beds
3
Baths
2,108
Sq Ft
$292/Sq Ft
Est. Value
About This Home
This home is located at 7 Christian Dr Unit 1, Nashua, NH 03063 and is currently estimated at $615,914, approximately $292 per square foot. 7 Christian Dr Unit 1 is a home located in Hillsborough County with nearby schools including Birch Hill Elementary School, Elm Street Middle School, and Nashua High School North.
Ownership History
Date
Name
Owned For
Owner Type
Purchase Details
Closed on
Jun 13, 2019
Sold by
Brundage Zebulon E and Brundage Mary A
Bought by
King Brian and Arcila Paula A
Current Estimated Value
Home Financials for this Owner
Home Financials are based on the most recent Mortgage that was taken out on this home.
Original Mortgage
$356,000
Outstanding Balance
$313,011
Interest Rate
4.1%
Mortgage Type
New Conventional
Estimated Equity
$302,903
Purchase Details
Closed on
Dec 6, 2016
Sold by
Brundage Zebulon F
Bought by
Brundage Zebulon F and Brundage Mary A
Purchase Details
Closed on
Mar 28, 2003
Sold by
Thelma R Wigfield T
Bought by
Brundage Zebulon E
Home Financials for this Owner
Home Financials are based on the most recent Mortgage that was taken out on this home.
Original Mortgage
$236,000
Interest Rate
5.91%
Mortgage Type
Purchase Money Mortgage
Create a Home Valuation Report for This Property
The Home Valuation Report is an in-depth analysis detailing your home's value as well as a comparison with similar homes in the area
Home Values in the Area
Average Home Value in this Area
Purchase History
| Date | Buyer | Sale Price | Title Company |
|---|---|---|---|
| King Brian | $375,000 | -- | |
| Brundage Zebulon F | -- | -- | |
| Brundage Zebulon E | $295,000 | -- |
Source: Public Records
Mortgage History
| Date | Status | Borrower | Loan Amount |
|---|---|---|---|
| Open | King Brian | $356,000 | |
| Previous Owner | Brundage Zebulon E | $198,750 | |
| Previous Owner | Brundage Zebulon E | $217,000 | |
| Previous Owner | Brundage Zebulon E | $236,000 |
Source: Public Records
Tax History Compared to Growth
Tax History
| Year | Tax Paid | Tax Assessment Tax Assessment Total Assessment is a certain percentage of the fair market value that is determined by local assessors to be the total taxable value of land and additions on the property. | Land | Improvement |
|---|---|---|---|---|
| 2024 | $7,896 | $496,600 | $151,100 | $345,500 |
| 2023 | $7,551 | $414,200 | $120,900 | $293,300 |
| 2022 | $7,485 | $414,200 | $120,900 | $293,300 |
| 2021 | $7,414 | $319,300 | $84,600 | $234,700 |
| 2020 | $7,219 | $319,300 | $84,600 | $234,700 |
| 2019 | $6,811 | $313,000 | $84,600 | $228,400 |
| 2018 | $6,639 | $313,000 | $84,600 | $228,400 |
| 2017 | $7,257 | $281,400 | $69,100 | $212,300 |
| 2016 | $7,055 | $281,400 | $69,100 | $212,300 |
| 2015 | $6,903 | $281,400 | $69,100 | $212,300 |
| 2014 | $6,768 | $281,400 | $69,100 | $212,300 |
Source: Public Records
Map
Nearby Homes
- 22 Cathedral Cir
- 14 Parrish Hill Dr
- 6 Cornwall Ln Unit 7
- 424 Broad St
- 5 Meghan Dr Unit U23
- 3 Richmond St
- 4 Nelson St
- 334 Broad St
- 27 Country Hill Rd Unit U90
- 11 Inca Dr
- 76 Bartemus Trail Unit U231
- 11 Bartemus Trail Unit 204
- 46 Scenic Dr
- 4 Jared Cir Unit U21
- 5 Chatfield Dr Unit U18
- 199 Pine Hill Rd
- 239 Broad St
- 599 W Hollis St
- 20 Martha St
- 40 Spring Cove Rd Unit U117