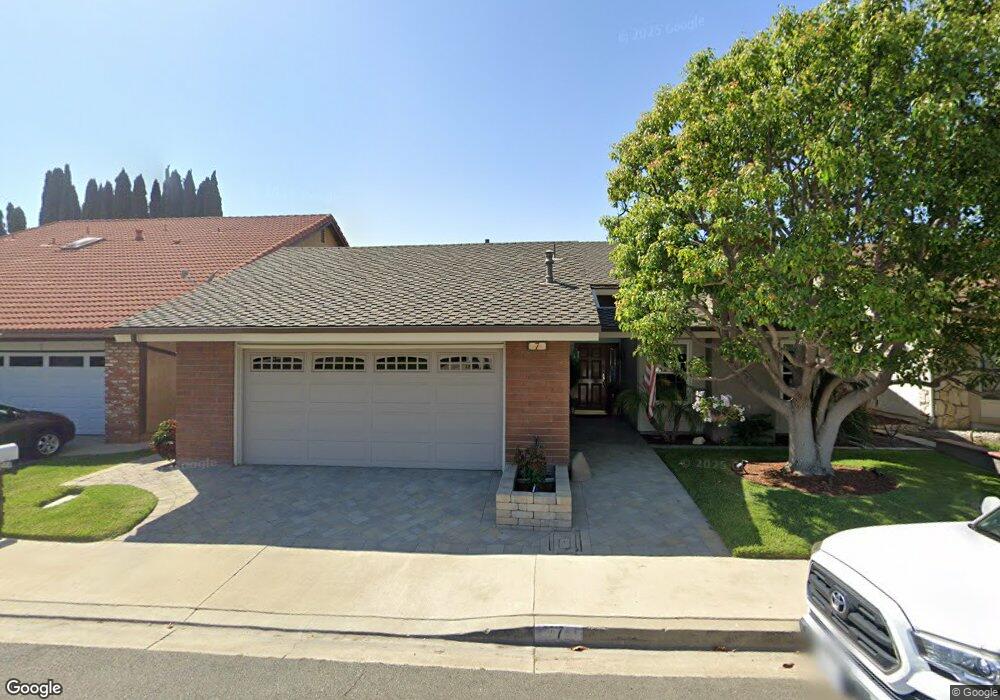
7 Colonial Irvine, CA 92620
Northwood NeighborhoodEstimated Value: $1,606,739 - $1,775,000
4
Beds
2
Baths
1,975
Sq Ft
$846/Sq Ft
Est. Value
About This Home
This home is located at 7 Colonial, Irvine, CA 92620 and is currently estimated at $1,670,435, approximately $845 per square foot. 7 Colonial is a home located in Orange County with nearby schools including Brywood Elementary School, Sierra Vista Middle School, and Northwood High School.
Ownership History
Date
Name
Owned For
Owner Type
Purchase Details
Closed on
Oct 14, 2020
Sold by
Billings Bruce G and Billings Marcia E
Bought by
Billings Bruce G and Billings Marcia E
Current Estimated Value
Home Financials for this Owner
Home Financials are based on the most recent Mortgage that was taken out on this home.
Original Mortgage
$346,500
Interest Rate
2.7%
Mortgage Type
New Conventional
Purchase Details
Closed on
Mar 21, 2017
Sold by
Billings Bruce G and Billings Marcia E
Bought by
Billings Bruce G and Billings Marcia E
Home Financials for this Owner
Home Financials are based on the most recent Mortgage that was taken out on this home.
Original Mortgage
$370,000
Interest Rate
4.17%
Mortgage Type
New Conventional
Purchase Details
Closed on
Jan 4, 2012
Sold by
Billings Bruce G and Billings Marcia E
Bought by
Billings Bruce G and Billings Marcia E
Home Financials for this Owner
Home Financials are based on the most recent Mortgage that was taken out on this home.
Original Mortgage
$188,400
Interest Rate
3.91%
Mortgage Type
New Conventional
Purchase Details
Closed on
May 14, 2004
Sold by
Billings Bruce G and Billings Marcia E
Bought by
Billings Bruce G and Billings Marcia E
Purchase Details
Closed on
Feb 15, 2003
Sold by
Landrum Marcia E and Billings Marcia E
Bought by
Billings Bruce G and Billings Marcia E
Home Financials for this Owner
Home Financials are based on the most recent Mortgage that was taken out on this home.
Original Mortgage
$280,800
Interest Rate
5.79%
Purchase Details
Closed on
Jan 3, 2000
Sold by
Landrum John P
Bought by
Landrum Marcia E
Purchase Details
Closed on
Apr 26, 1999
Sold by
Landrum John P and Landrum Marcia E
Bought by
Landrum John P and Landrum Marcia E
Home Financials for this Owner
Home Financials are based on the most recent Mortgage that was taken out on this home.
Original Mortgage
$250,000
Interest Rate
8.75%
Purchase Details
Closed on
Apr 4, 1997
Sold by
Landrum John P and Landrum Marcia E
Bought by
Landrum John P and Landrum Marcia E
Create a Home Valuation Report for This Property
The Home Valuation Report is an in-depth analysis detailing your home's value as well as a comparison with similar homes in the area
Home Values in the Area
Average Home Value in this Area
Purchase History
| Date | Buyer | Sale Price | Title Company |
|---|---|---|---|
| Billings Bruce G | -- | Bnt Title Company Of Ca | |
| Billings Bruce G | -- | North American Title | |
| Billings Bruce G | -- | North American Title | |
| Billings Bruce G | -- | First American Title Company | |
| Billings Bruce G | -- | First American Title Company | |
| Billings Bruce G | -- | -- | |
| Billings Bruce G | -- | Fidelity National Title | |
| Landrum Marcia E | -- | -- | |
| Landrum John P | -- | Fidelity National Title | |
| Landrum John P | -- | -- |
Source: Public Records
Mortgage History
| Date | Status | Borrower | Loan Amount |
|---|---|---|---|
| Closed | Billings Bruce G | $346,500 | |
| Closed | Billings Bruce G | $370,000 | |
| Closed | Billings Bruce G | $188,400 | |
| Closed | Billings Bruce G | $280,800 | |
| Closed | Landrum John P | $250,000 |
Source: Public Records
Tax History
| Year | Tax Paid | Tax Assessment Tax Assessment Total Assessment is a certain percentage of the fair market value that is determined by local assessors to be the total taxable value of land and additions on the property. | Land | Improvement |
|---|---|---|---|---|
| 2025 | $3,849 | $357,486 | $138,640 | $218,846 |
| 2024 | $3,849 | $350,477 | $135,922 | $214,555 |
| 2023 | $3,750 | $343,605 | $133,256 | $210,349 |
| 2022 | $3,674 | $336,868 | $130,643 | $206,225 |
| 2021 | $3,588 | $330,263 | $128,081 | $202,182 |
| 2020 | $3,568 | $326,877 | $126,768 | $200,109 |
| 2019 | $3,489 | $320,468 | $124,282 | $196,186 |
| 2018 | $3,426 | $314,185 | $121,845 | $192,340 |
| 2017 | $3,355 | $308,025 | $119,456 | $188,569 |
| 2016 | $3,211 | $301,986 | $117,114 | $184,872 |
| 2015 | $3,163 | $297,450 | $115,354 | $182,096 |
| 2014 | $3,103 | $291,624 | $113,095 | $178,529 |
Source: Public Records
Map
Nearby Homes
Your Personal Tour Guide
Ask me questions while you tour the home.