Estimated Value: $871,000 - $958,000
3
Beds
4
Baths
1,960
Sq Ft
$465/Sq Ft
Est. Value
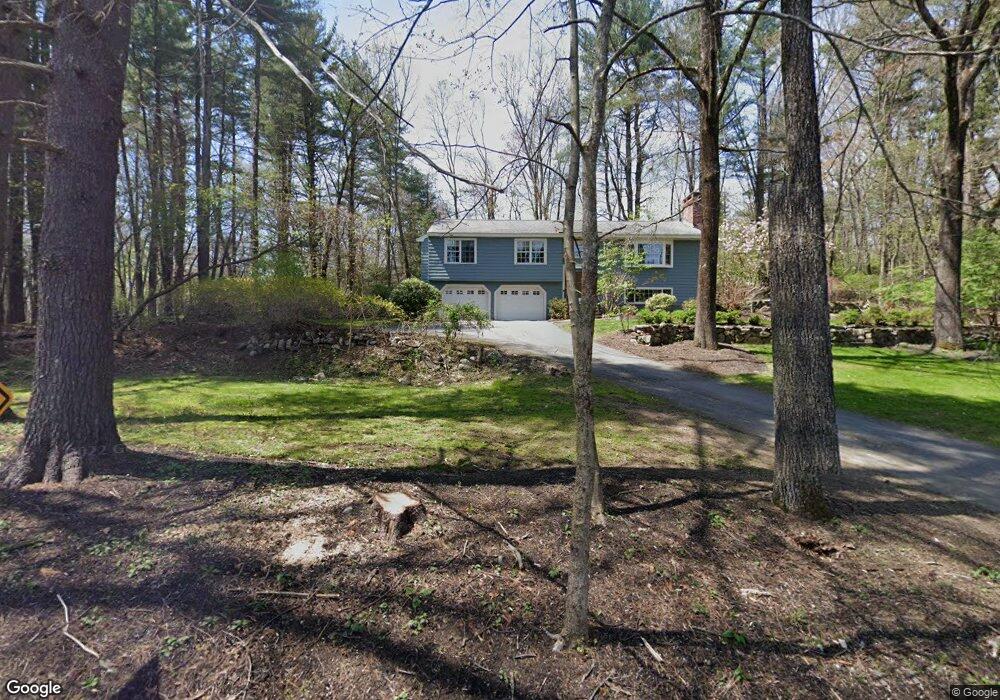
About This Home
This home is located at 7 Conant St, Acton, MA 01720 and is currently estimated at $911,097, approximately $464 per square foot. 7 Conant St is a home located in Middlesex County with nearby schools including Acton-Boxborough Regional High School, Maynard Knowledge Beginnings, and The Imago School.
Ownership History
Date
Name
Owned For
Owner Type
Purchase Details
Closed on
Sep 29, 1999
Sold by
Dominguez Phillip E and Dominguez Alice E
Bought by
Haller Kirk D and Thandi Neeza
Current Estimated Value
Home Financials for this Owner
Home Financials are based on the most recent Mortgage that was taken out on this home.
Original Mortgage
$274,050
Interest Rate
7.85%
Mortgage Type
Purchase Money Mortgage
Purchase Details
Closed on
Sep 1, 1992
Sold by
Morris John J and Morris Susan G
Bought by
Dominguez Phillip E and Dominguez Alice E
Create a Home Valuation Report for This Property
The Home Valuation Report is an in-depth analysis detailing your home's value as well as a comparison with similar homes in the area
Home Values in the Area
Average Home Value in this Area
Purchase History
| Date | Buyer | Sale Price | Title Company |
|---|---|---|---|
| Haller Kirk D | $288,500 | -- | |
| Dominguez Phillip E | $186,000 | -- |
Source: Public Records
Mortgage History
| Date | Status | Borrower | Loan Amount |
|---|---|---|---|
| Open | Dominguez Phillip E | $427,482 | |
| Closed | Dominguez Phillip E | $274,500 | |
| Closed | Dominguez Phillip E | $274,050 |
Source: Public Records
Tax History
| Year | Tax Paid | Tax Assessment Tax Assessment Total Assessment is a certain percentage of the fair market value that is determined by local assessors to be the total taxable value of land and additions on the property. | Land | Improvement |
|---|---|---|---|---|
| 2025 | $14,725 | $858,600 | $315,200 | $543,400 |
| 2024 | $13,869 | $832,000 | $315,200 | $516,800 |
| 2023 | $13,686 | $779,400 | $286,600 | $492,800 |
| 2022 | $13,292 | $683,400 | $249,200 | $434,200 |
| 2021 | $12,429 | $614,400 | $230,800 | $383,600 |
| 2020 | $11,821 | $614,400 | $230,800 | $383,600 |
| 2019 | $11,246 | $580,600 | $230,800 | $349,800 |
| 2018 | $10,518 | $542,700 | $230,800 | $311,900 |
| 2017 | $10,085 | $529,100 | $230,800 | $298,300 |
| 2016 | $9,705 | $504,700 | $230,800 | $273,900 |
| 2015 | $9,184 | $482,100 | $230,800 | $251,300 |
| 2014 | $8,920 | $458,600 | $230,800 | $227,800 |
Source: Public Records
Map
Nearby Homes
- 40 High St
- 30 Brewster Ln
- 63 Conant St
- 131 Main St
- 129 Main St Unit 129
- 70 River St
- 1 Vanderbelt Rd
- 25 Nylander Way
- 71 Liberty St
- 36 Brown St
- 128 Parker St Unit 3B
- 1 Drummer Rd Unit A5
- 7 Hillcrest Dr
- 184 Main St Unit 3
- 31 Drummer Rd Unit 31
- 12 Brown St
- 70 Powder Mill Rd
- 68 Powder Mill Rd
- 66 Powder Mill Rd
- 2 & 6 Powder Mill Rd
Your Personal Tour Guide
Ask me questions while you tour the home.