A
Seller's Agent in 2025
Alexander Colarusso
Colarusso Realty
(617) 960-7731
1 in this area
46 Total Sales
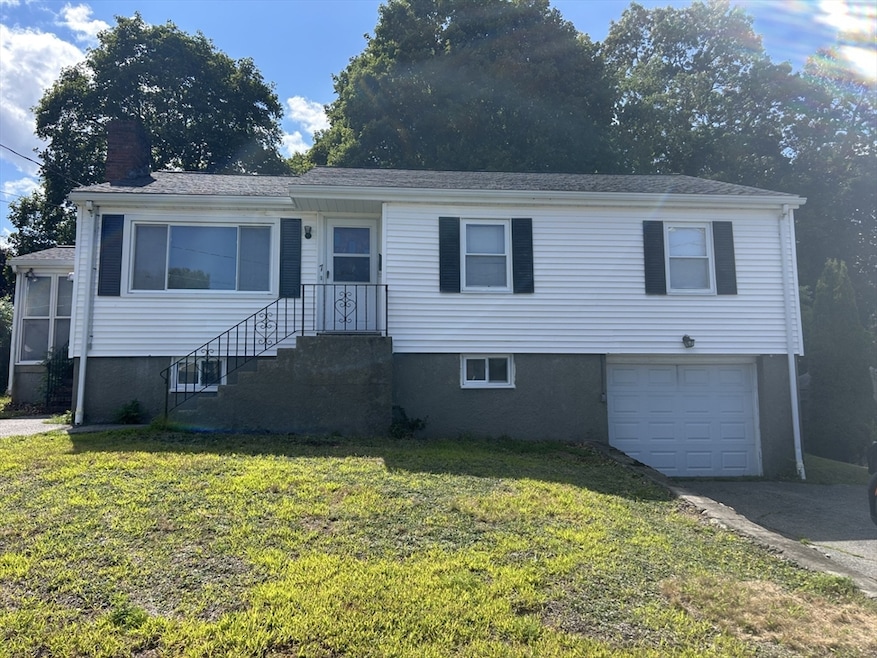


Welcome to 7 Coolidge Road Wakefield! This charming three bedroom, two-bath ranch offers a wonderful opportunity to create instant equity and make it your own. Featuring a versatile lower level, the home provides plenty of flexibility for living, working, or entertaining. The property includes an extended one car garage under the home plus a four car driveway ideal for accommodating multiple vehicles. Enjoy the bonus of a beautiful enclosed sunroom, perfect for relaxing, and a spacious backyard, offering endless potential for outdoor enjoyment. Located in a quiet, desirable neighborhood, this home combines convenience with tranquility just minutes from everything Wakefield has to offer. Easy access to Route 1, Route 95 and Route 93. This is a multigenerational home that has been owned by the same family for the past 40 years. Private Showings Only.
| Date | Type | Sale Price | Title Company |
|---|---|---|---|
| Quit Claim Deed | $637,500 | -- | |
| Quit Claim Deed | -- | None Available | |
| Quit Claim Deed | $285,000 | -- | |
| Quit Claim Deed | $285,000 | -- |
| Date | Status | Loan Amount | Loan Type |
|---|---|---|---|
| Open | $505,000 | Purchase Money Mortgage | |
| Previous Owner | $228,000 | New Conventional |
| Date | Event | Price | List to Sale | Price per Sq Ft |
|---|---|---|---|---|
| 10/30/2025 10/30/25 | Sold | $637,500 | -1.9% | $354 / Sq Ft |
| 09/16/2025 09/16/25 | Pending | -- | -- | -- |
| 09/10/2025 09/10/25 | For Sale | $649,900 | -- | $361 / Sq Ft |
| Year | Tax Paid | Tax Assessment Tax Assessment Total Assessment is a certain percentage of the fair market value that is determined by local assessors to be the total taxable value of land and additions on the property. | Land | Improvement |
|---|---|---|---|---|
| 2025 | $7,375 | $649,800 | $386,200 | $263,600 |
| 2024 | $6,801 | $604,500 | $359,300 | $245,200 |
| 2023 | $6,618 | $564,200 | $335,300 | $228,900 |
| 2022 | $6,208 | $503,900 | $299,400 | $204,500 |
| 2021 | $5,983 | $470,000 | $273,700 | $196,300 |
| 2020 | $5,626 | $440,600 | $256,600 | $184,000 |
| 2019 | $5,277 | $411,300 | $239,500 | $171,800 |
| 2018 | $5,095 | $393,400 | $228,800 | $164,600 |
| 2017 | $4,791 | $367,700 | $213,900 | $153,800 |
| 2016 | $4,859 | $360,200 | $211,100 | $149,100 |
| 2015 | $4,537 | $336,600 | $197,300 | $139,300 |
| 2014 | $4,197 | $328,400 | $192,500 | $135,900 |
A
Seller's Agent in 2025
Alexander Colarusso
Colarusso Realty
(617) 960-7731
1 in this area
46 Total Sales

Buyer's Agent in 2025
Alexander Zedros
Harbor View Real Estate Corp.
(781) 910-5300
1 in this area
32 Total Sales
Source: MLS Property Information Network (MLS PIN)
MLS Number: 73429184
APN: WAKE-000019-000262-S000000-000046A
Disclaimer: Certain information contained herein is derived from information provided by parties other than Homes.com. All information provided is deemed reliable, but is not guaranteed to be accurate and should be independently verified.
![]() The property listing data and information, or the Images, set forth herein were provided to MLS Property Information Network, Inc. from third party sources, including sellers, lessors and public records, and were compiled by MLS Property Information Network, Inc. The property listing data and information, and the Images, are for the personal, non-commercial use of consumers having a good faith interest in purchasing or leasing listed properties of the type displayed to them and may not be used for any purpose other than to identify prospective properties which such consumers may have a good faith interest in purchasing or leasing. MLS Property Information Network, Inc. and its subscribers disclaim any and all representations and warranties as to the accuracy of the property listing data and information, or as to the accuracy of any of the Images, set forth herein.
The property listing data and information, or the Images, set forth herein were provided to MLS Property Information Network, Inc. from third party sources, including sellers, lessors and public records, and were compiled by MLS Property Information Network, Inc. The property listing data and information, and the Images, are for the personal, non-commercial use of consumers having a good faith interest in purchasing or leasing listed properties of the type displayed to them and may not be used for any purpose other than to identify prospective properties which such consumers may have a good faith interest in purchasing or leasing. MLS Property Information Network, Inc. and its subscribers disclaim any and all representations and warranties as to the accuracy of the property listing data and information, or as to the accuracy of any of the Images, set forth herein.
Ask me questions while you tour the home.