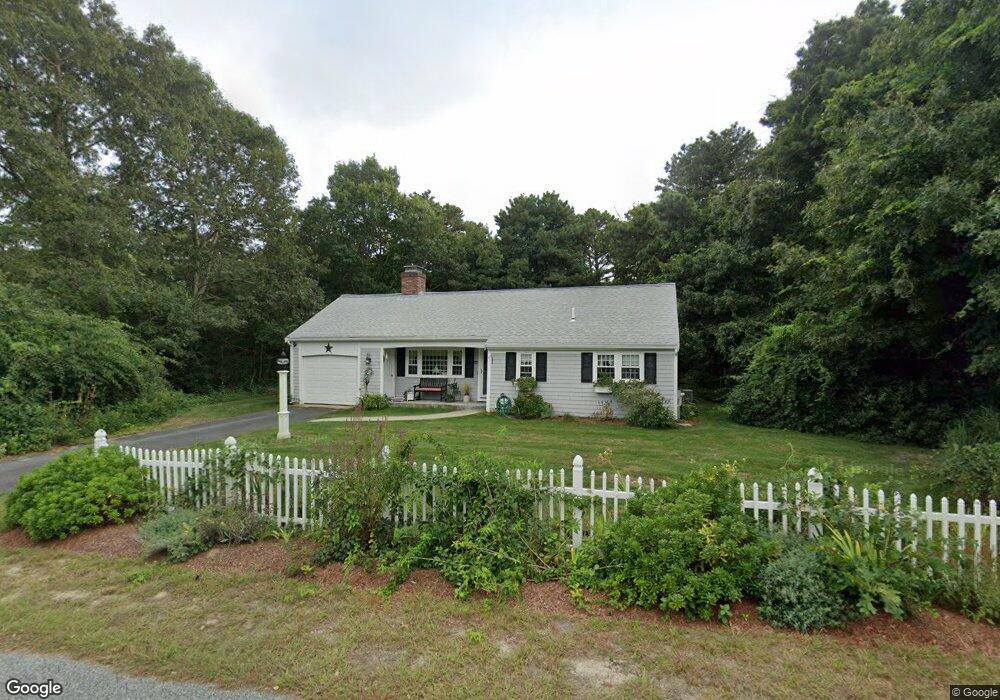
7 Copley Place South Yarmouth, MA 02664
Estimated Value: $562,000 - $633,000
2
Beds
1
Bath
800
Sq Ft
$740/Sq Ft
Est. Value
About This Home
This home is located at 7 Copley Place, South Yarmouth, MA 02664 and is currently estimated at $591,721, approximately $739 per square foot. 7 Copley Place is a home located in Barnstable County with nearby schools including Dennis-Yarmouth Regional High School and St. Pius X. School.
Ownership History
Date
Name
Owned For
Owner Type
Purchase Details
Closed on
Jan 10, 2018
Sold by
Adams Alice J
Bought by
Alice J Adams Ret
Current Estimated Value
Purchase Details
Closed on
Nov 10, 1998
Sold by
King Nt and King David P
Bought by
Adams Alice J
Home Financials for this Owner
Home Financials are based on the most recent Mortgage that was taken out on this home.
Original Mortgage
$93,500
Interest Rate
6.64%
Mortgage Type
Purchase Money Mortgage
Create a Home Valuation Report for This Property
The Home Valuation Report is an in-depth analysis detailing your home's value as well as a comparison with similar homes in the area
Home Values in the Area
Average Home Value in this Area
Purchase History
| Date | Buyer | Sale Price | Title Company |
|---|---|---|---|
| Alice J Adams Ret | -- | -- | |
| Adams Alice J | $110,000 | -- |
Source: Public Records
Mortgage History
| Date | Status | Borrower | Loan Amount |
|---|---|---|---|
| Previous Owner | Adams Alice J | $93,500 |
Source: Public Records
Tax History Compared to Growth
Tax History
| Year | Tax Paid | Tax Assessment Tax Assessment Total Assessment is a certain percentage of the fair market value that is determined by local assessors to be the total taxable value of land and additions on the property. | Land | Improvement |
|---|---|---|---|---|
| 2025 | $3,951 | $558,100 | $175,000 | $383,100 |
| 2024 | $3,718 | $503,800 | $152,200 | $351,600 |
| 2023 | $3,577 | $441,000 | $131,700 | $309,300 |
| 2022 | $3,352 | $365,100 | $119,700 | $245,400 |
| 2021 | $3,126 | $327,000 | $119,700 | $207,300 |
| 2020 | $3,042 | $304,200 | $119,700 | $184,500 |
| 2019 | $2,655 | $262,900 | $119,700 | $143,200 |
| 2018 | $2,523 | $245,200 | $102,000 | $143,200 |
| 2017 | $2,412 | $240,700 | $97,500 | $143,200 |
| 2016 | $2,314 | $231,900 | $88,700 | $143,200 |
| 2015 | $2,184 | $217,500 | $88,700 | $128,800 |
Source: Public Records
Map
Nearby Homes