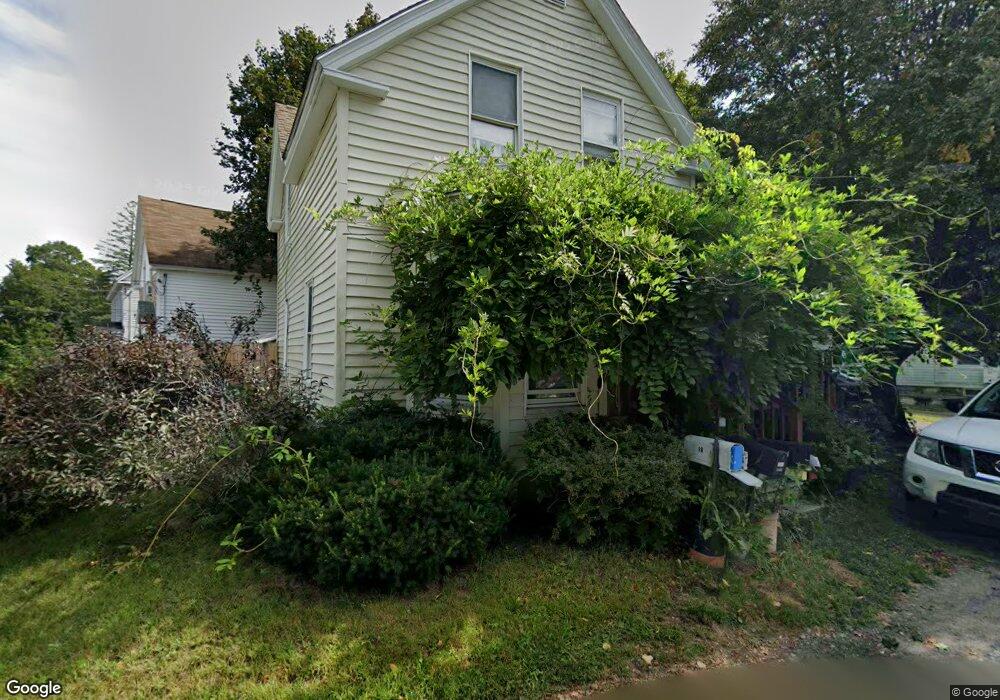
7 Crescent St Pepperell, MA 01463
Estimated Value: $325,306 - $395,000
3
Beds
1
Bath
1,074
Sq Ft
$336/Sq Ft
Est. Value
About This Home
This home is located at 7 Crescent St, Pepperell, MA 01463 and is currently estimated at $360,827, approximately $335 per square foot. 7 Crescent St is a home located in Middlesex County with nearby schools including North Middlesex Regional High School, Pepperell Christian Academy, and Maple Dene & Moppet School.
Ownership History
Date
Name
Owned For
Owner Type
Purchase Details
Closed on
Jan 5, 2010
Sold by
Gerken Timothy G and Gerken Deborah A
Bought by
Gerken Timothy G
Current Estimated Value
Home Financials for this Owner
Home Financials are based on the most recent Mortgage that was taken out on this home.
Original Mortgage
$39,000
Outstanding Balance
$25,476
Interest Rate
4.85%
Estimated Equity
$335,351
Purchase Details
Closed on
Nov 6, 1995
Sold by
Domestic Loan & Inv Bk
Bought by
Gerken Timothy G and Gerken Carol R
Home Financials for this Owner
Home Financials are based on the most recent Mortgage that was taken out on this home.
Original Mortgage
$68,500
Interest Rate
7.58%
Mortgage Type
Purchase Money Mortgage
Purchase Details
Closed on
Nov 24, 1992
Sold by
Poulin Robert A and Poulin Rita T
Bought by
Domestic Loan & Inv Bk
Create a Home Valuation Report for This Property
The Home Valuation Report is an in-depth analysis detailing your home's value as well as a comparison with similar homes in the area
Home Values in the Area
Average Home Value in this Area
Purchase History
| Date | Buyer | Sale Price | Title Company |
|---|---|---|---|
| Gerken Timothy G | -- | -- | |
| Gerken Timothy G | $78,500 | -- | |
| Domestic Loan & Inv Bk | $81,027 | -- |
Source: Public Records
Mortgage History
| Date | Status | Borrower | Loan Amount |
|---|---|---|---|
| Open | Gerken Timothy G | $39,000 | |
| Previous Owner | Domestic Loan & Inv Bk | $68,500 |
Source: Public Records
Tax History
| Year | Tax Paid | Tax Assessment Tax Assessment Total Assessment is a certain percentage of the fair market value that is determined by local assessors to be the total taxable value of land and additions on the property. | Land | Improvement |
|---|---|---|---|---|
| 2025 | $3,915 | $267,600 | $74,200 | $193,400 |
| 2024 | $3,738 | $260,500 | $67,100 | $193,400 |
| 2023 | $3,579 | $236,400 | $67,100 | $169,300 |
| 2022 | $3,416 | $199,200 | $60,000 | $139,200 |
| 2021 | $3,390 | $189,200 | $53,000 | $136,200 |
| 2020 | $15,026 | $190,300 | $53,000 | $137,300 |
| 2019 | $2,928 | $176,500 | $53,000 | $123,500 |
| 2018 | $0 | $162,300 | $53,000 | $109,300 |
| 2017 | $2,471 | $155,500 | $49,400 | $106,100 |
| 2016 | $2,445 | $147,900 | $49,400 | $98,500 |
| 2015 | $2,359 | $147,900 | $49,400 | $98,500 |
| 2014 | $2,295 | $144,700 | $49,400 | $95,300 |
Source: Public Records
Map
Nearby Homes
- 69 Main St Unit 71
- 113-115 Main St
- 39 Hollis St Unit A
- 72 Main St
- 38 River Rd Unit 11
- 14 Brookline St
- 28-30 Groton St
- 29 Tarbell St
- 38 Tarbell St Unit 1D
- 13 Birch Dr
- 114 Groton St
- 8 Casie Ln
- 58 Lowell Rd
- 17 Merrimac Dr
- 27 Merrimac Dr
- 90 Townsend St
- 96 Townsend St
- 39 Mount Lebanon St
- 208 North St
- 142 River Rd
Your Personal Tour Guide
Ask me questions while you tour the home.