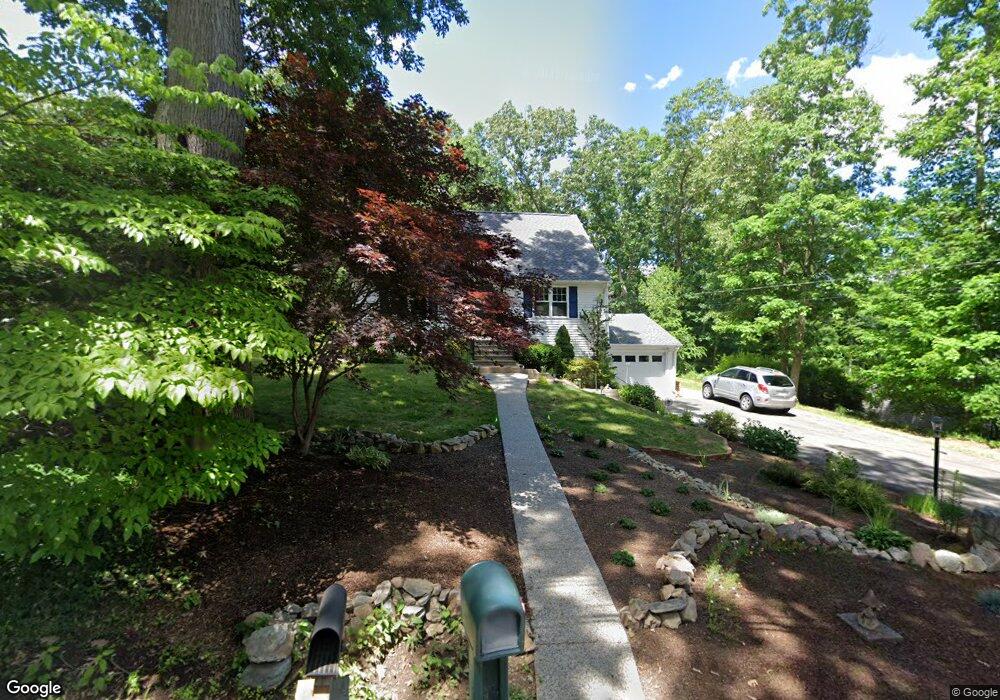
7 Cullen Hill Rd Lincoln, RI 02865
Lime Rock NeighborhoodEstimated Value: $535,309 - $588,000
3
Beds
2
Baths
1,547
Sq Ft
$361/Sq Ft
Est. Value
About This Home
This home is located at 7 Cullen Hill Rd, Lincoln, RI 02865 and is currently estimated at $558,827, approximately $361 per square foot. 7 Cullen Hill Rd is a home located in Providence County with nearby schools including Lincoln Senior High School and Blackstone Valley Prep Elementary School 1.
Ownership History
Date
Name
Owned For
Owner Type
Purchase Details
Closed on
Jun 8, 2021
Sold by
Hatch Donald R and Hatch Linda A
Bought by
Hatch Ft and Hatch
Current Estimated Value
Home Financials for this Owner
Home Financials are based on the most recent Mortgage that was taken out on this home.
Original Mortgage
$196,000
Outstanding Balance
$176,679
Interest Rate
2.9%
Mortgage Type
New Conventional
Estimated Equity
$382,148
Purchase Details
Closed on
Oct 15, 2018
Sold by
Hatch Donald R and Hatch Linda A
Bought by
Hatch Ft 2018 and Hatch
Purchase Details
Closed on
Mar 16, 2011
Sold by
Benson Paul E and Benson Joyce A
Bought by
Hatch Donald R and Hatch Linda A
Purchase Details
Closed on
Dec 3, 1993
Sold by
New Concepts Remod Inc
Bought by
Hatch Donald R and Hatch Linda
Create a Home Valuation Report for This Property
The Home Valuation Report is an in-depth analysis detailing your home's value as well as a comparison with similar homes in the area
Home Values in the Area
Average Home Value in this Area
Purchase History
| Date | Buyer | Sale Price | Title Company |
|---|---|---|---|
| Hatch Ft | -- | None Available | |
| Hatch Donald R | -- | None Available | |
| Hatch Ft 2018 | -- | -- | |
| Hatch Donald R | -- | -- | |
| Hatch Donald R | $150,000 | -- |
Source: Public Records
Mortgage History
| Date | Status | Borrower | Loan Amount |
|---|---|---|---|
| Open | Hatch Donald R | $196,000 | |
| Closed | Hatch Ft | $196,000 | |
| Previous Owner | Hatch Donald R | $205,000 | |
| Previous Owner | Hatch Donald R | $25,000 |
Source: Public Records
Tax History Compared to Growth
Tax History
| Year | Tax Paid | Tax Assessment Tax Assessment Total Assessment is a certain percentage of the fair market value that is determined by local assessors to be the total taxable value of land and additions on the property. | Land | Improvement |
|---|---|---|---|---|
| 2025 | $6,425 | $475,200 | $197,400 | $277,800 |
| 2024 | $6,222 | $358,600 | $149,700 | $208,900 |
| 2023 | $5,913 | $358,600 | $149,700 | $208,900 |
| 2022 | $5,899 | $358,600 | $149,700 | $208,900 |
| 2021 | $2,985 | $271,800 | $117,000 | $154,800 |
| 2020 | $2,958 | $271,800 | $117,000 | $154,800 |
| 2018 | $5,212 | $233,200 | $88,600 | $144,600 |
| 2017 | $5,107 | $233,200 | $88,600 | $144,600 |
| 2016 | $5,037 | $233,200 | $88,600 | $144,600 |
| 2015 | $5,153 | $219,000 | $84,200 | $134,800 |
| 2014 | $5,162 | $219,000 | $84,200 | $134,800 |
Source: Public Records
Map
Nearby Homes
- 103 Old River Rd
- 1251 Mendon Rd
- 1 Cray St
- 987 Mendon Rd
- 34 Dexter Rock Rd
- 6 Cushing St
- 128 Old River Rd
- 73 Scott Rd
- 0 Whitman Way Unit 1183628
- 0 Whitman Way Unit 1183679
- 8 Valentine Ct
- 461 River Rd
- 6 Streamview Dr
- 200 Old Mendon Rd
- 7 Maria St
- 1 Pat Dr
- 1 Ashley Dr
- 418 River Rd
- 64 Peacedale Rd
- 500 Mendon Rd Unit 216
- 9 Cullen Hill Rd
- 10 Cullen Hill Rd
- 11 Cullen Hill Rd
- 8 Cullen Hill Rd
- 12 Cullen Hill Rd
- 6 Cullen Hill Rd
- 14 Cullen Hill Rd
- 31 Martins Way
- 29 Martins Way
- 17 Cullen Hill Rd
- 4 Cullen Hill Rd
- 16 Cullen Hill Rd
- 806 Lower River Rd
- 800 Lower River Rd
- 35 Martins Way
- 33 Martins Way
- 23 Martins Way
- 18 Cullen Hill Rd
- 810 Lower River Rd
- 818 Lower River Rd