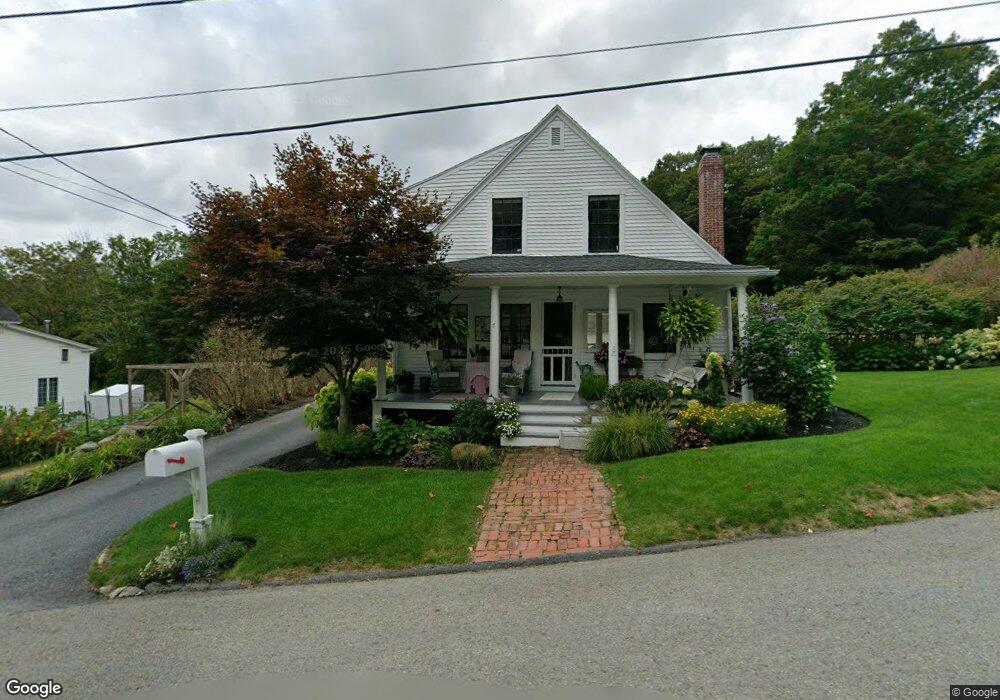
7 Cushing St Ashburnham, MA 01430
Estimated Value: $327,000 - $408,000
3
Beds
2
Baths
1,542
Sq Ft
$239/Sq Ft
Est. Value
About This Home
This home is located at 7 Cushing St, Ashburnham, MA 01430 and is currently estimated at $368,618, approximately $239 per square foot. 7 Cushing St is a home located in Worcester County with nearby schools including Oakmont Regional High School and Cushing Academy.
Ownership History
Date
Name
Owned For
Owner Type
Purchase Details
Closed on
Dec 29, 2003
Sold by
Kreidler James M
Bought by
Kreidler Dianna L and Kreidler James M
Current Estimated Value
Purchase Details
Closed on
Mar 2, 1998
Sold by
Moryl Polli J
Bought by
Kreidler James M
Home Financials for this Owner
Home Financials are based on the most recent Mortgage that was taken out on this home.
Original Mortgage
$89,600
Interest Rate
6.85%
Mortgage Type
Purchase Money Mortgage
Purchase Details
Closed on
Apr 30, 1993
Sold by
Dietsche Marion L
Bought by
Moryl-Krediler James M
Create a Home Valuation Report for This Property
The Home Valuation Report is an in-depth analysis detailing your home's value as well as a comparison with similar homes in the area
Home Values in the Area
Average Home Value in this Area
Purchase History
| Date | Buyer | Sale Price | Title Company |
|---|---|---|---|
| Kreidler Dianna L | -- | -- | |
| Kreidler Dianna L | -- | -- | |
| Kreidler James M | $20,000 | -- | |
| Kreidler James M | $20,000 | -- | |
| Moryl-Krediler James M | $90,000 | -- | |
| Moryl-Krediler James M | $90,000 | -- |
Source: Public Records
Mortgage History
| Date | Status | Borrower | Loan Amount |
|---|---|---|---|
| Previous Owner | Moryl-Krediler James M | $36,200 | |
| Previous Owner | Moryl-Krediler James M | $13,000 | |
| Previous Owner | Moryl-Krediler James M | $89,600 |
Source: Public Records
Tax History
| Year | Tax Paid | Tax Assessment Tax Assessment Total Assessment is a certain percentage of the fair market value that is determined by local assessors to be the total taxable value of land and additions on the property. | Land | Improvement |
|---|---|---|---|---|
| 2025 | $4,344 | $292,100 | $36,500 | $255,600 |
| 2024 | $4,293 | $272,600 | $36,500 | $236,100 |
| 2023 | $4,401 | $265,900 | $36,500 | $229,400 |
| 2022 | $4,286 | $227,000 | $35,900 | $191,100 |
| 2021 | $4,281 | $208,300 | $35,900 | $172,400 |
| 2020 | $4,187 | $208,300 | $35,900 | $172,400 |
| 2019 | $3,592 | $159,300 | $35,900 | $123,400 |
| 2018 | $3,360 | $143,600 | $34,100 | $109,500 |
| 2017 | $3,338 | $145,300 | $36,900 | $108,400 |
| 2016 | $3,242 | $142,500 | $36,300 | $106,200 |
| 2015 | $3,175 | $142,500 | $36,300 | $106,200 |
Source: Public Records
Map
Nearby Homes
Your Personal Tour Guide
Ask me questions while you tour the home.