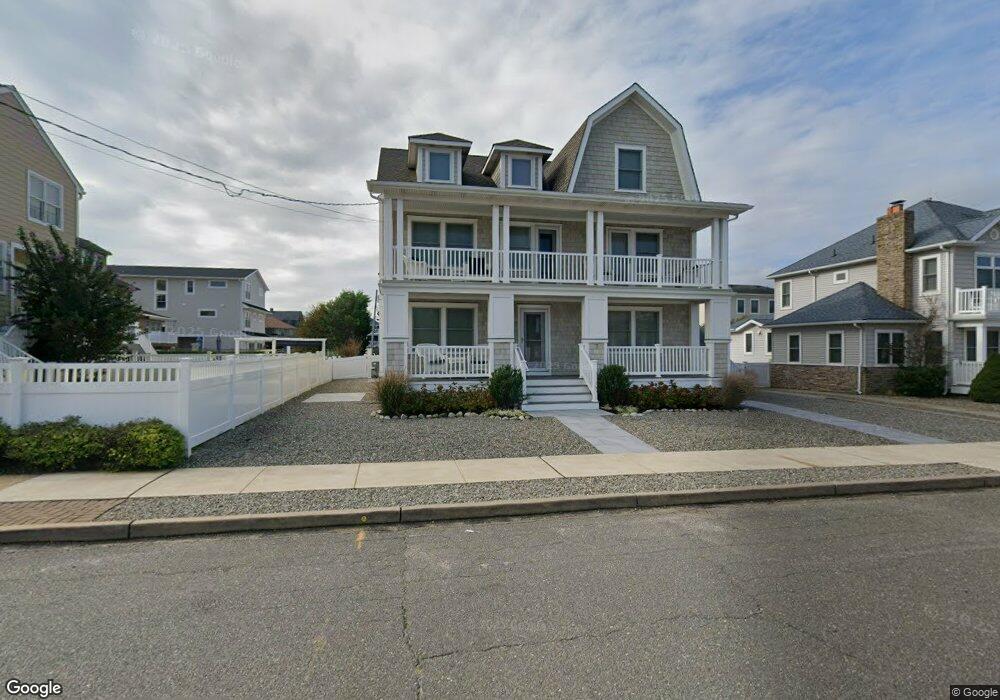
7 D St Seaside Park, NJ 08752
Estimated Value: $1,483,000 - $2,165,000
4
Beds
3
Baths
3,672
Sq Ft
$486/Sq Ft
Est. Value
About This Home
This home is located at 7 D St, Seaside Park, NJ 08752 and is currently estimated at $1,786,126, approximately $486 per square foot. 7 D St is a home located in Ocean County with nearby schools including Central Regional Middle School and Central Regional High School.
Ownership History
Date
Name
Owned For
Owner Type
Purchase Details
Closed on
Nov 27, 2007
Sold by
Suskind Jay and Suskind Robin Poliner
Bought by
Suskind Robin Poliner
Current Estimated Value
Purchase Details
Closed on
Apr 6, 2005
Sold by
Bjaamj Llc
Bought by
Suskind Jay and Suskind Robin
Home Financials for this Owner
Home Financials are based on the most recent Mortgage that was taken out on this home.
Original Mortgage
$300,000
Outstanding Balance
$139,208
Interest Rate
4.25%
Mortgage Type
Fannie Mae Freddie Mac
Estimated Equity
$1,646,918
Purchase Details
Closed on
Sep 29, 1997
Sold by
Johnson Gertrude K
Bought by
Johnson Wilmer R and Johnson Denis W
Purchase Details
Closed on
Nov 13, 1994
Sold by
Johnson Wilmer R and Johnson Gertrude K
Bought by
Johnson Wilmer R and Johnson Gertrude K
Create a Home Valuation Report for This Property
The Home Valuation Report is an in-depth analysis detailing your home's value as well as a comparison with similar homes in the area
Home Values in the Area
Average Home Value in this Area
Purchase History
| Date | Buyer | Sale Price | Title Company |
|---|---|---|---|
| Suskind Robin Poliner | -- | None Available | |
| Suskind Jay | $1,200,000 | Pegasus Title Agency Llc | |
| Johnson Wilmer R | -- | -- | |
| Johnson Wilmer R | -- | -- |
Source: Public Records
Mortgage History
| Date | Status | Borrower | Loan Amount |
|---|---|---|---|
| Open | Suskind Jay | $300,000 |
Source: Public Records
Tax History Compared to Growth
Tax History
| Year | Tax Paid | Tax Assessment Tax Assessment Total Assessment is a certain percentage of the fair market value that is determined by local assessors to be the total taxable value of land and additions on the property. | Land | Improvement |
|---|---|---|---|---|
| 2025 | $15,218 | $930,200 | $586,000 | $344,200 |
| 2024 | $14,967 | $930,200 | $586,000 | $344,200 |
| 2023 | $14,437 | $930,200 | $586,000 | $344,200 |
| 2022 | $12,793 | $824,300 | $586,000 | $238,300 |
| 2021 | $12,521 | $824,300 | $586,000 | $238,300 |
| 2020 | $12,389 | $824,300 | $586,000 | $238,300 |
| 2019 | $12,257 | $824,300 | $586,000 | $238,300 |
| 2018 | $11,458 | $824,300 | $586,000 | $238,300 |
| 2017 | $11,631 | $824,300 | $586,000 | $238,300 |
| 2016 | $10,815 | $824,300 | $586,000 | $238,300 |
| 2015 | $11,285 | $824,300 | $586,000 | $238,300 |
| 2014 | $10,782 | $824,300 | $586,000 | $238,300 |
Source: Public Records
Map
Nearby Homes