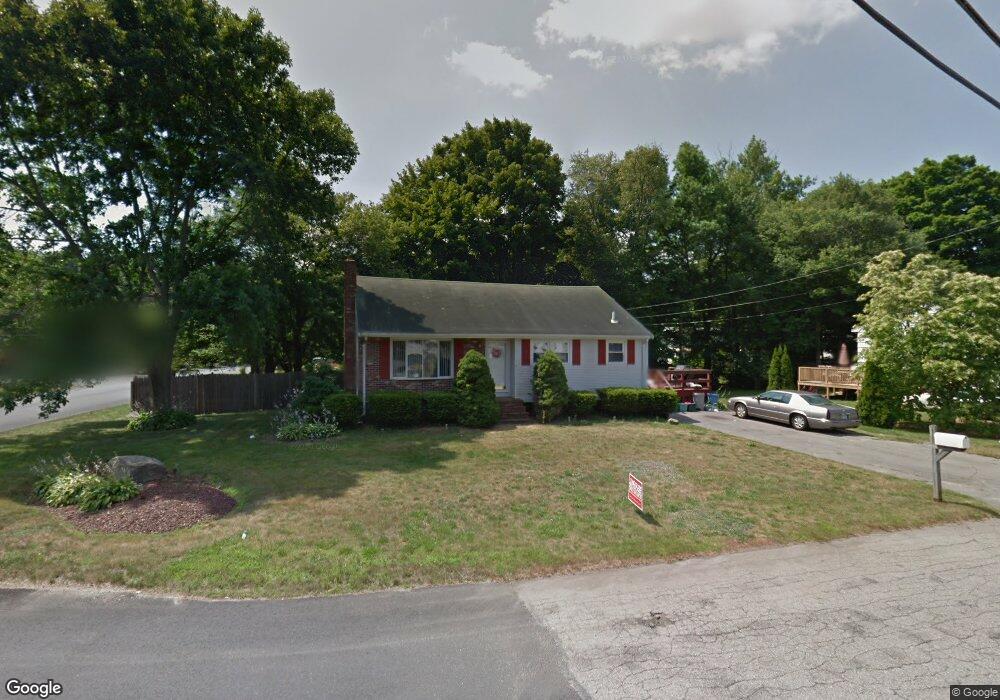
7 Darren Dr Brockton, MA 02301
Brockton Heights NeighborhoodEstimated Value: $530,000 - $553,782
3
Beds
2
Baths
1,526
Sq Ft
$355/Sq Ft
Est. Value
About This Home
This home is located at 7 Darren Dr, Brockton, MA 02301 and is currently estimated at $541,446, approximately $354 per square foot. 7 Darren Dr is a home located in Plymouth County with nearby schools including Hancock Elementary School, Manthala George Jr. School, and Louis F Angelo Elementary School.
Ownership History
Date
Name
Owned For
Owner Type
Purchase Details
Closed on
Oct 15, 2010
Sold by
Becker Robert J and Webby-Becker Terese
Bought by
Webby-Becker Terese
Current Estimated Value
Purchase Details
Closed on
May 26, 1989
Sold by
Calter Thomas J
Bought by
Becker Robert J
Home Financials for this Owner
Home Financials are based on the most recent Mortgage that was taken out on this home.
Original Mortgage
$130,500
Interest Rate
10.99%
Mortgage Type
Purchase Money Mortgage
Create a Home Valuation Report for This Property
The Home Valuation Report is an in-depth analysis detailing your home's value as well as a comparison with similar homes in the area
Home Values in the Area
Average Home Value in this Area
Purchase History
| Date | Buyer | Sale Price | Title Company |
|---|---|---|---|
| Webby-Becker Terese | -- | -- | |
| Becker Robert J | $145,000 | -- |
Source: Public Records
Mortgage History
| Date | Status | Borrower | Loan Amount |
|---|---|---|---|
| Previous Owner | Becker Robert J | $130,500 | |
| Previous Owner | Becker Robert J | $109,600 |
Source: Public Records
Tax History Compared to Growth
Tax History
| Year | Tax Paid | Tax Assessment Tax Assessment Total Assessment is a certain percentage of the fair market value that is determined by local assessors to be the total taxable value of land and additions on the property. | Land | Improvement |
|---|---|---|---|---|
| 2025 | $5,533 | $456,900 | $145,000 | $311,900 |
| 2024 | $5,319 | $442,500 | $145,000 | $297,500 |
| 2023 | $5,053 | $389,300 | $110,000 | $279,300 |
| 2022 | $4,796 | $343,300 | $100,000 | $243,300 |
| 2021 | $4,678 | $322,600 | $95,000 | $227,600 |
| 2020 | $4,693 | $309,800 | $91,000 | $218,800 |
| 2019 | $4,120 | $265,100 | $85,500 | $179,600 |
| 2018 | $4,624 | $252,300 | $85,500 | $166,800 |
| 2017 | $4,607 | $234,900 | $85,500 | $149,400 |
| 2016 | $3,953 | $227,700 | $81,500 | $146,200 |
| 2015 | $3,824 | $210,700 | $81,500 | $129,200 |
| 2014 | $3,245 | $179,000 | $81,500 | $97,500 |
Source: Public Records
Map
Nearby Homes