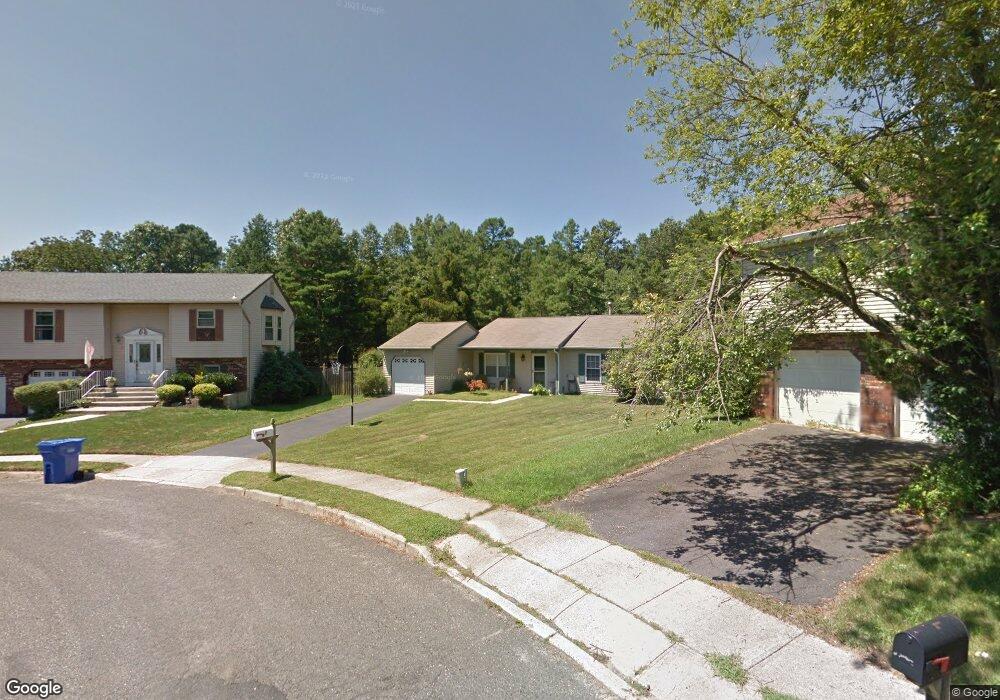
7 Deck Ct Howell, NJ 07731
Southard NeighborhoodEstimated Value: $533,000 - $580,000
3
Beds
2
Baths
1,246
Sq Ft
$451/Sq Ft
Est. Value
About This Home
This home is located at 7 Deck Ct, Howell, NJ 07731 and is currently estimated at $562,435, approximately $451 per square foot. 7 Deck Ct is a home located in Monmouth County with nearby schools including Taunton School, Aldrich School, and Howell Township Middle School South.
Ownership History
Date
Name
Owned For
Owner Type
Purchase Details
Closed on
Apr 29, 2021
Sold by
Friendship Inc
Bought by
Fahmy Jason and Fahmy Angela
Current Estimated Value
Home Financials for this Owner
Home Financials are based on the most recent Mortgage that was taken out on this home.
Original Mortgage
$677,563
Interest Rate
3%
Mortgage Type
New Conventional
Purchase Details
Closed on
Aug 30, 2010
Sold by
Bac Home Loans Servicing Lp
Bought by
Annunziata Gregory
Home Financials for this Owner
Home Financials are based on the most recent Mortgage that was taken out on this home.
Original Mortgage
$568,000
Interest Rate
4.36%
Mortgage Type
New Conventional
Purchase Details
Closed on
Mar 16, 2010
Sold by
Krutyansky Gene and Krutyansky Allison J
Bought by
Bac Home Loans Servicing Lp
Purchase Details
Closed on
Oct 26, 2006
Sold by
Toll Nj Lp
Bought by
Krutyansky Gene and Krutyansky Allison J
Home Financials for this Owner
Home Financials are based on the most recent Mortgage that was taken out on this home.
Original Mortgage
$840,119
Interest Rate
6.47%
Purchase Details
Closed on
Aug 23, 2002
Sold by
Kaplan Daniel
Bought by
Fyfe Kelly
Home Financials for this Owner
Home Financials are based on the most recent Mortgage that was taken out on this home.
Original Mortgage
$199,900
Interest Rate
6.25%
Purchase Details
Closed on
Sep 23, 1999
Sold by
Miller Lucas
Bought by
Kaplan Daniel and Kaplan Maryann Bove
Home Financials for this Owner
Home Financials are based on the most recent Mortgage that was taken out on this home.
Original Mortgage
$132,925
Interest Rate
7.68%
Mortgage Type
FHA
Purchase Details
Closed on
Jun 16, 1998
Sold by
Kozak Frank
Bought by
Miller Lucas and Miller Melanie Cronin
Home Financials for this Owner
Home Financials are based on the most recent Mortgage that was taken out on this home.
Original Mortgage
$119,000
Interest Rate
7.09%
Create a Home Valuation Report for This Property
The Home Valuation Report is an in-depth analysis detailing your home's value as well as a comparison with similar homes in the area
Home Values in the Area
Average Home Value in this Area
Purchase History
| Date | Buyer | Sale Price | Title Company |
|---|---|---|---|
| Fahmy Jason | $846,954 | Innovation Title Inc | |
| Annunziata Gregory | $710,000 | North American Title Agency | |
| Bac Home Loans Servicing Lp | -- | North American Title Agency | |
| Krutyansky Gene | $884,336 | -- | |
| Fyfe Kelly | $249,900 | -- | |
| Kaplan Daniel | $147,000 | -- | |
| Miller Lucas | $125,500 | -- |
Source: Public Records
Mortgage History
| Date | Status | Borrower | Loan Amount |
|---|---|---|---|
| Previous Owner | Fahmy Jason | $677,563 | |
| Previous Owner | Annunziata Gregory | $568,000 | |
| Previous Owner | Krutyansky Gene | $840,119 | |
| Previous Owner | Fyfe Kelly | $199,900 | |
| Previous Owner | Kaplan Daniel | $132,925 | |
| Previous Owner | Miller Lucas | $119,000 |
Source: Public Records
Tax History
| Year | Tax Paid | Tax Assessment Tax Assessment Total Assessment is a certain percentage of the fair market value that is determined by local assessors to be the total taxable value of land and additions on the property. | Land | Improvement |
|---|---|---|---|---|
| 2025 | $8,328 | $523,000 | $379,000 | $144,000 |
| 2024 | $7,725 | $468,400 | $327,000 | $141,400 |
| 2023 | $7,725 | $415,100 | $277,000 | $138,100 |
| 2022 | $6,289 | $293,500 | $162,000 | $131,500 |
| 2021 | $6,079 | $273,900 | $157,000 | $116,900 |
| 2020 | $6,079 | $261,800 | $146,200 | $115,600 |
| 2019 | $6,402 | $270,600 | $157,000 | $113,600 |
| 2018 | $6,074 | $255,100 | $137,000 | $118,100 |
| 2017 | $5,936 | $246,500 | $132,000 | $114,500 |
| 2016 | $5,560 | $228,600 | $117,000 | $111,600 |
| 2015 | $5,545 | $225,700 | $117,000 | $108,700 |
| 2014 | $5,121 | $193,400 | $107,000 | $86,400 |
Source: Public Records
Map
Nearby Homes
Your Personal Tour Guide
Ask me questions while you tour the home.