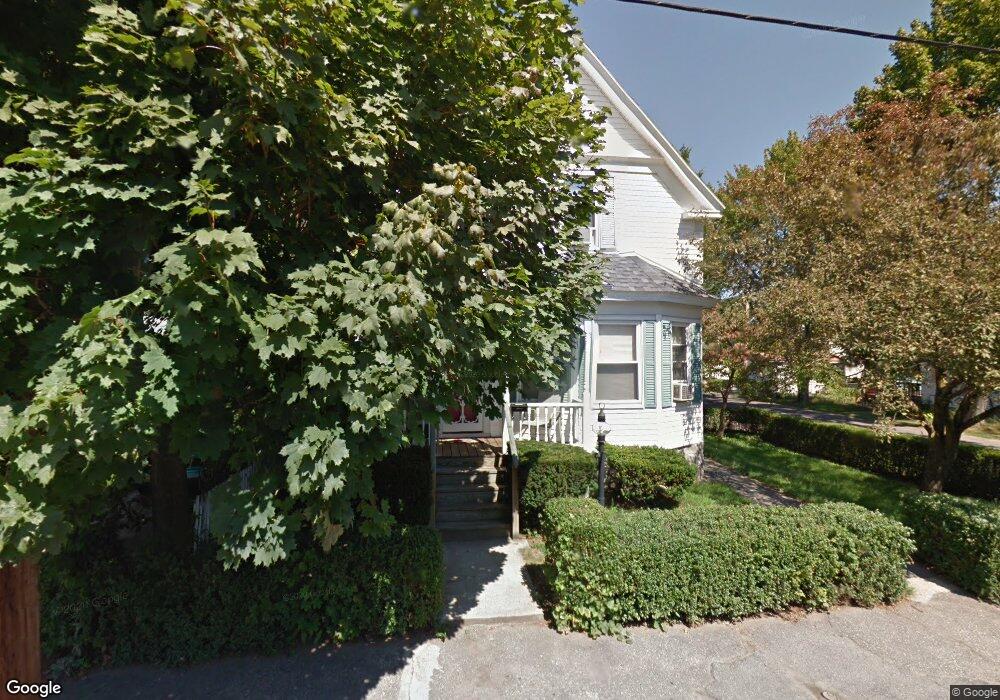
7 Dewey St Methuen, MA 01844
The East End NeighborhoodEstimated Value: $514,865 - $553,000
3
Beds
2
Baths
1,331
Sq Ft
$398/Sq Ft
Est. Value
About This Home
This home is located at 7 Dewey St, Methuen, MA 01844 and is currently estimated at $529,466, approximately $397 per square foot. 7 Dewey St is a home located in Essex County with nearby schools including Timony Grammar School, Methuen High School, and Notre Dame Cristo Rey High School.
Ownership History
Date
Name
Owned For
Owner Type
Purchase Details
Closed on
Feb 2, 2010
Sold by
Fnma
Bought by
Frye Eric and Frye Elizabeth
Current Estimated Value
Home Financials for this Owner
Home Financials are based on the most recent Mortgage that was taken out on this home.
Original Mortgage
$210,123
Outstanding Balance
$140,322
Interest Rate
5.37%
Mortgage Type
FHA
Estimated Equity
$389,144
Purchase Details
Closed on
Nov 3, 2009
Sold by
Grimanis Peter J and Gmac Mortgage Llc
Bought by
Federal National Mortgage Association
Purchase Details
Closed on
Dec 12, 1997
Sold by
Cusack Bryan T
Bought by
Grimanis Peter J
Create a Home Valuation Report for This Property
The Home Valuation Report is an in-depth analysis detailing your home's value as well as a comparison with similar homes in the area
Home Values in the Area
Average Home Value in this Area
Purchase History
| Date | Buyer | Sale Price | Title Company |
|---|---|---|---|
| Frye Eric | $214,550 | -- | |
| Frye Eric | $214,550 | -- | |
| Federal National Mortgage Association | $226,506 | -- | |
| Federal National Mortgage Association | $226,506 | -- | |
| Grimanis Peter J | $118,000 | -- | |
| Grimanis Peter J | $118,000 | -- |
Source: Public Records
Mortgage History
| Date | Status | Borrower | Loan Amount |
|---|---|---|---|
| Open | Frye Eric | $210,123 | |
| Closed | Grimanis Peter J | $210,123 |
Source: Public Records
Tax History
| Year | Tax Paid | Tax Assessment Tax Assessment Total Assessment is a certain percentage of the fair market value that is determined by local assessors to be the total taxable value of land and additions on the property. | Land | Improvement |
|---|---|---|---|---|
| 2025 | $4,451 | $420,700 | $196,600 | $224,100 |
| 2024 | $4,381 | $403,400 | $179,300 | $224,100 |
| 2023 | $4,138 | $353,700 | $159,400 | $194,300 |
| 2022 | $3,884 | $297,600 | $126,200 | $171,400 |
| 2021 | $3,655 | $277,100 | $119,500 | $157,600 |
| 2020 | $3,633 | $270,300 | $119,500 | $150,800 |
| 2019 | $3,450 | $243,100 | $112,900 | $130,200 |
| 2018 | $3,276 | $229,600 | $106,300 | $123,300 |
| 2017 | $3,163 | $215,900 | $106,300 | $109,600 |
| 2016 | $3,001 | $202,600 | $93,000 | $109,600 |
| 2015 | $2,840 | $194,500 | $93,000 | $101,500 |
Source: Public Records
Map
Nearby Homes
- 65 Arthur St
- 37 Albion St
- 12 Annette St
- 173 Jackson St
- 25-27 Bicknell Ave
- 68 Ashford St
- 14 Court St
- 593 Prospect St
- 7 Erhardt Terrace
- 39 Swan Ave
- 18 Erhardt Terrace
- 611 Prospect St
- 106 Leroy Ave
- 396 Oak St
- 32 Josephine Ave
- 687 Jackson St
- 97 Kenwood Rd
- 264 E Haverhill St Unit 2
- 30 Anderson Dr
- 129-131 Lexington St
Your Personal Tour Guide
Ask me questions while you tour the home.