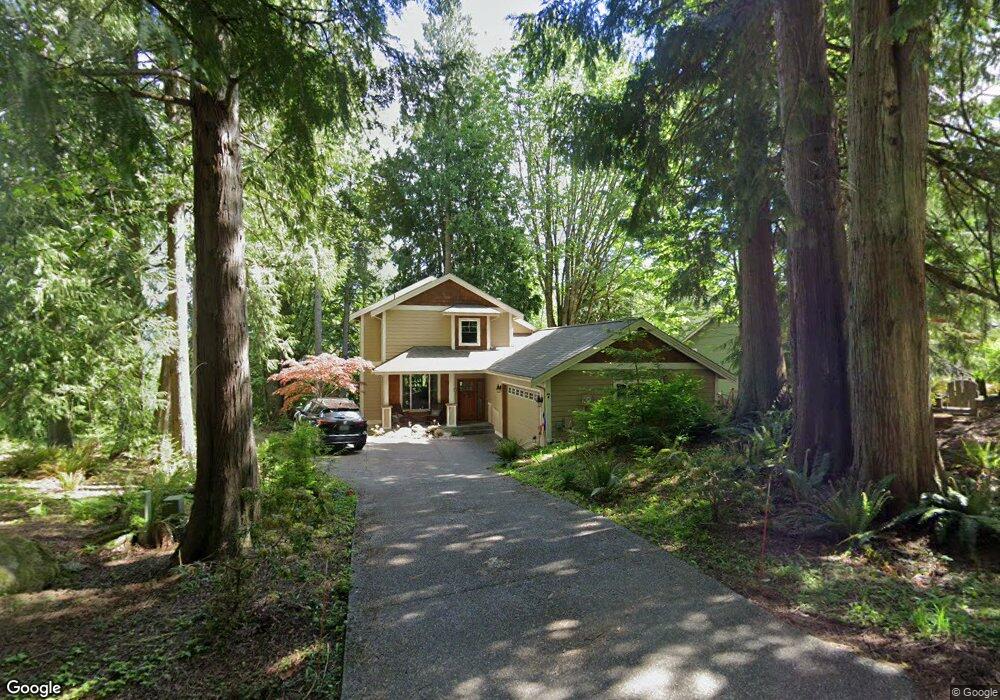
7 Doe Ct Bellingham, WA 98229
Estimated Value: $671,000 - $845,000
4
Beds
4
Baths
2,753
Sq Ft
$273/Sq Ft
Est. Value
About This Home
This home is located at 7 Doe Ct, Bellingham, WA 98229 and is currently estimated at $751,205, approximately $272 per square foot. 7 Doe Ct is a home located in Whatcom County with nearby schools including Geneva Elementary School, Kulshan Middle School, and Bellingham High School.
Ownership History
Date
Name
Owned For
Owner Type
Purchase Details
Closed on
Feb 27, 2018
Sold by
Hibier Robert J and Cooper Hibier Lisa L
Bought by
Conwell Peter M and Diemont Conwell Susan M
Current Estimated Value
Home Financials for this Owner
Home Financials are based on the most recent Mortgage that was taken out on this home.
Original Mortgage
$263,000
Outstanding Balance
$223,060
Interest Rate
4.32%
Mortgage Type
New Conventional
Estimated Equity
$528,145
Purchase Details
Closed on
Oct 25, 2005
Sold by
Szubski Jan S and Szubski Anna
Bought by
Hibler Robert J and Cooper Hibler Lisa L
Home Financials for this Owner
Home Financials are based on the most recent Mortgage that was taken out on this home.
Original Mortgage
$52,425
Interest Rate
5.68%
Mortgage Type
Purchase Money Mortgage
Purchase Details
Closed on
May 1, 2003
Sold by
Mendenhall Sherri L
Bought by
Szubski Jan S and Szubski Anna
Create a Home Valuation Report for This Property
The Home Valuation Report is an in-depth analysis detailing your home's value as well as a comparison with similar homes in the area
Home Values in the Area
Average Home Value in this Area
Purchase History
| Date | Buyer | Sale Price | Title Company |
|---|---|---|---|
| Conwell Peter M | $459,000 | Chicago Title | |
| Hibler Robert J | $70,180 | Chicago Title Insurance | |
| Szubski Jan S | -- | Whatcom Land Title |
Source: Public Records
Mortgage History
| Date | Status | Borrower | Loan Amount |
|---|---|---|---|
| Open | Conwell Peter M | $263,000 | |
| Previous Owner | Hibler Robert J | $52,425 |
Source: Public Records
Tax History
| Year | Tax Paid | Tax Assessment Tax Assessment Total Assessment is a certain percentage of the fair market value that is determined by local assessors to be the total taxable value of land and additions on the property. | Land | Improvement |
|---|---|---|---|---|
| 2025 | $6,311 | $696,114 | $136,944 | $559,170 |
| 2024 | $5,951 | $685,825 | $134,920 | $550,905 |
| 2023 | $5,951 | $690,014 | $135,744 | $554,270 |
| 2022 | $4,680 | $594,856 | $117,024 | $477,832 |
| 2021 | $4,491 | $431,055 | $84,800 | $346,255 |
| 2020 | $4,047 | $406,656 | $80,000 | $326,656 |
| 2019 | $3,718 | $360,803 | $69,044 | $291,759 |
| 2018 | $3,730 | $338,784 | $64,800 | $273,984 |
| 2017 | $3,147 | $289,523 | $55,350 | $234,173 |
| 2016 | $2,816 | $254,738 | $48,600 | $206,138 |
| 2015 | $2,820 | $238,723 | $46,323 | $192,400 |
| 2014 | -- | $231,905 | $45,000 | $186,905 |
| 2013 | -- | $229,332 | $42,600 | $186,732 |
Source: Public Records
Map
Nearby Homes
- 9 Doe Ct
- 11 Autumn Vista Place
- 177 Harbor View Dr
- 2500 Lake Whatcom Blvd
- 5 Plum Ln
- 209 Harbor View Dr
- 15 A N Summit Dr
- 8 Twin Flower Cir
- 55 Green Hill Rd
- 39 Stable Ln
- 2 Kinglet Ct
- 124 Sudden Valley Dr
- 33 Green Hill Rd
- 203 Sudden Valley Dr
- 2 Jasper Ridge Ln
- 6 Green Hill Rd
- 28 Hillside Place
- 2562 Lake Whatcom Blvd
- 14 Granite Cir
- 11 Granite Cir
Your Personal Tour Guide
Ask me questions while you tour the home.