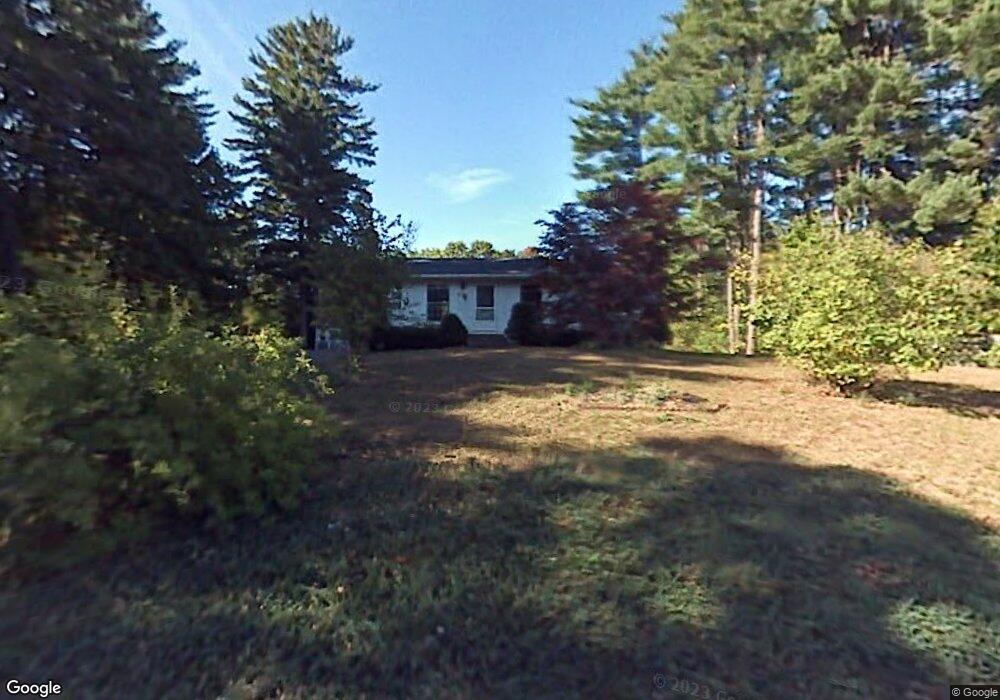
7 Duggan Ln Southampton, MA 01073
Estimated Value: $345,000 - $402,000
3
Beds
2
Baths
960
Sq Ft
$385/Sq Ft
Est. Value
About This Home
This home is located at 7 Duggan Ln, Southampton, MA 01073 and is currently estimated at $369,448, approximately $384 per square foot. 7 Duggan Ln is a home located in Hampshire County with nearby schools including William E Norris School, Hilltown Cooperative Charter Public School, and Calvary Baptist Christian School.
Ownership History
Date
Name
Owned For
Owner Type
Purchase Details
Closed on
Jul 31, 2009
Sold by
Campbell Gary R and Campbell Sandra S
Bought by
Huxley Brett T
Current Estimated Value
Home Financials for this Owner
Home Financials are based on the most recent Mortgage that was taken out on this home.
Original Mortgage
$178,400
Interest Rate
5.43%
Mortgage Type
Purchase Money Mortgage
Purchase Details
Closed on
Sep 17, 2008
Sold by
Ocwen Loan Servicing L
Bought by
Campbell Gary R and Campbell Sandra S
Purchase Details
Closed on
Sep 5, 2008
Sold by
Lendia Inc
Bought by
Reo Prop Corp
Purchase Details
Closed on
Apr 28, 1995
Sold by
Wiater Helen
Bought by
Disanto Christopher and Disanto Kathleen M
Home Financials for this Owner
Home Financials are based on the most recent Mortgage that was taken out on this home.
Original Mortgage
$116,750
Interest Rate
8.33%
Mortgage Type
Purchase Money Mortgage
Purchase Details
Closed on
May 15, 1990
Sold by
Turomsha Denise M
Bought by
Wiater Helen
Create a Home Valuation Report for This Property
The Home Valuation Report is an in-depth analysis detailing your home's value as well as a comparison with similar homes in the area
Home Values in the Area
Average Home Value in this Area
Purchase History
| Date | Buyer | Sale Price | Title Company |
|---|---|---|---|
| Huxley Brett T | $223,000 | -- | |
| Campbell Gary R | $141,000 | -- | |
| Reo Prop Corp | $158,100 | -- | |
| Disanto Christopher | $114,500 | -- | |
| Wiater Helen | $113,500 | -- |
Source: Public Records
Mortgage History
| Date | Status | Borrower | Loan Amount |
|---|---|---|---|
| Open | Wiater Helen | $174,400 | |
| Closed | Huxley Brett T | $178,400 | |
| Previous Owner | Wiater Helen | $116,000 | |
| Previous Owner | Wiater Helen | $116,750 |
Source: Public Records
Tax History Compared to Growth
Tax History
| Year | Tax Paid | Tax Assessment Tax Assessment Total Assessment is a certain percentage of the fair market value that is determined by local assessors to be the total taxable value of land and additions on the property. | Land | Improvement |
|---|---|---|---|---|
| 2025 | $3,414 | $240,900 | $84,200 | $156,700 |
| 2024 | $3,333 | $233,900 | $84,200 | $149,700 |
| 2023 | $3,137 | $218,900 | $84,200 | $134,700 |
| 2022 | $3,133 | $207,900 | $75,200 | $132,700 |
| 2021 | $3,041 | $190,400 | $69,400 | $121,000 |
| 2020 | $2,977 | $188,200 | $69,400 | $118,800 |
| 2019 | $2,918 | $178,900 | $69,400 | $109,500 |
| 2018 | $2,744 | $164,100 | $62,500 | $101,600 |
| 2017 | $2,678 | $164,100 | $62,500 | $101,600 |
| 2015 | $3,019 | $192,200 | $87,900 | $104,300 |
Source: Public Records
Map
Nearby Homes
- 12 Golden Cir
- 10 Golden Cir
- 0 Glendale Rd
- 38 College Hwy
- 20 Pomeroy Meadow Rd
- 17 Glendale Rd
- 68 College Hwy
- 43 Loudville Rd
- M143 &152 Glendale St
- 385 Main St
- 6 Newell St
- 64 South St Unit 7
- 41 South St Unit 17
- 1 Hillside Meadows Dr
- 2 Little St
- 20 Meadowbrook Dr
- 5 Laurin Ln
- 10 Parc Place Unit 2
- 125 Park St
- 6 S St & Abutting Lots
- 5 Duggan Ln
- 8 Duggan Ln
- 9 Duggan Ln
- 11 Duggan Ln
- 9 Kingsberry Ln
- 5 Kingsberry Ln
- 176 Pomeroy Meadow Rd
- 14 Duggan Ln
- 3 Kingsberry Ln
- 15 Kingsberry Ln
- 8 Kingsberry Ln
- 6 Kingsberry Ln
- 182 Pomeroy Meadow Rd
- 13 Duggan Ln
- 0 Duggan Ln
- 15 Duggan Ln
- 12 Kingsberry Ln
- 181 Pomeroy Meadow Rd
- 172 Pomeroy Meadow Rd
- 179 Pomeroy Meadow Rd