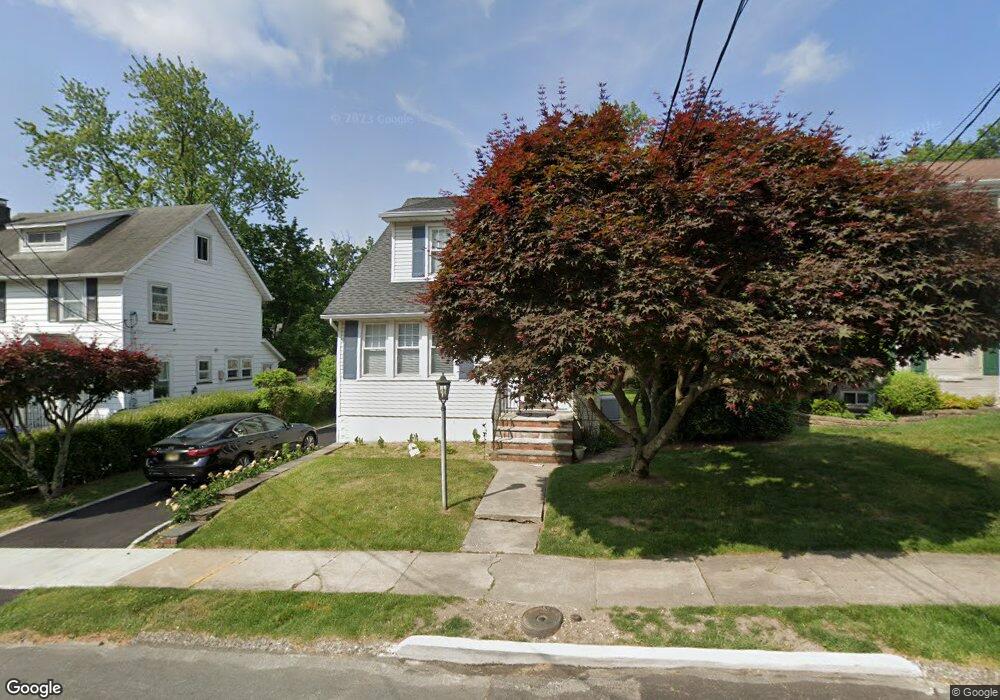
7 Duncan St Millburn, NJ 07041
Estimated Value: $1,033,646 - $1,368,000
Studio
--
Bath
1,454
Sq Ft
$774/Sq Ft
Est. Value
About This Home
This home is located at 7 Duncan St, Millburn, NJ 07041 and is currently estimated at $1,125,912, approximately $774 per square foot. 7 Duncan St is a home located in Essex County with nearby schools including South Mountain School, Millburn Middle School, and Millburn High School.
Ownership History
Date
Name
Owned For
Owner Type
Purchase Details
Closed on
Aug 7, 2014
Sold by
Esposito Michael A
Bought by
Esposito Michael A
Current Estimated Value
Purchase Details
Closed on
Apr 11, 1994
Sold by
Palma Donald E
Bought by
Esposito Michael and Esposito Lisa
Home Financials for this Owner
Home Financials are based on the most recent Mortgage that was taken out on this home.
Original Mortgage
$148,000
Interest Rate
7.7%
Create a Home Valuation Report for This Property
The Home Valuation Report is an in-depth analysis detailing your home's value as well as a comparison with similar homes in the area
Home Values in the Area
Average Home Value in this Area
Purchase History
| Date | Buyer | Sale Price | Title Company |
|---|---|---|---|
| Esposito Michael A | -- | -- | |
| Esposito Michael A | -- | -- | |
| Esposito Michael | $185,000 | -- |
Source: Public Records
Mortgage History
| Date | Status | Borrower | Loan Amount |
|---|---|---|---|
| Previous Owner | Esposito Michael | $148,000 |
Source: Public Records
Tax History
| Year | Tax Paid | Tax Assessment Tax Assessment Total Assessment is a certain percentage of the fair market value that is determined by local assessors to be the total taxable value of land and additions on the property. | Land | Improvement |
|---|---|---|---|---|
| 2025 | $12,724 | $650,500 | $472,100 | $178,400 |
| 2024 | $12,724 | $650,500 | $472,100 | $178,400 |
| 2022 | $12,639 | $650,500 | $472,100 | $178,400 |
| 2021 | $12,607 | $650,500 | $472,100 | $178,400 |
| 2020 | $12,529 | $650,500 | $472,100 | $178,400 |
| 2019 | $12,555 | $650,500 | $472,100 | $178,400 |
| 2018 | $12,373 | $650,500 | $472,100 | $178,400 |
| 2017 | $12,073 | $650,500 | $472,100 | $178,400 |
| 2016 | $9,557 | $443,700 | $231,300 | $212,400 |
| 2015 | $9,340 | $443,700 | $231,300 | $212,400 |
| 2014 | $8,945 | $443,700 | $231,300 | $212,400 |
Source: Public Records
Map
Nearby Homes
- 19 Bodwell Terrace
- 96 Rector St
- 90 Whitney Rd
- 8 Woodstone Cir
- 5 Brookside Dr
- 92 Hobart Ave
- 27 Willow St Unit A
- 7 Willow St
- 221 Main St
- 8 Willow St
- 270 Main St Unit D
- 298 Main St
- 20 Barnsdale Rd
- 67 Montview Ave
- 40 Highland Ave
- 5 Farley Rd
- 29 S Mountain Rd
- 445 Morris Ave Unit 4C
- 445 Morris Ave Unit 11D
- 445 Morris Ave Unit D11
Your Personal Tour Guide
Ask me questions while you tour the home.