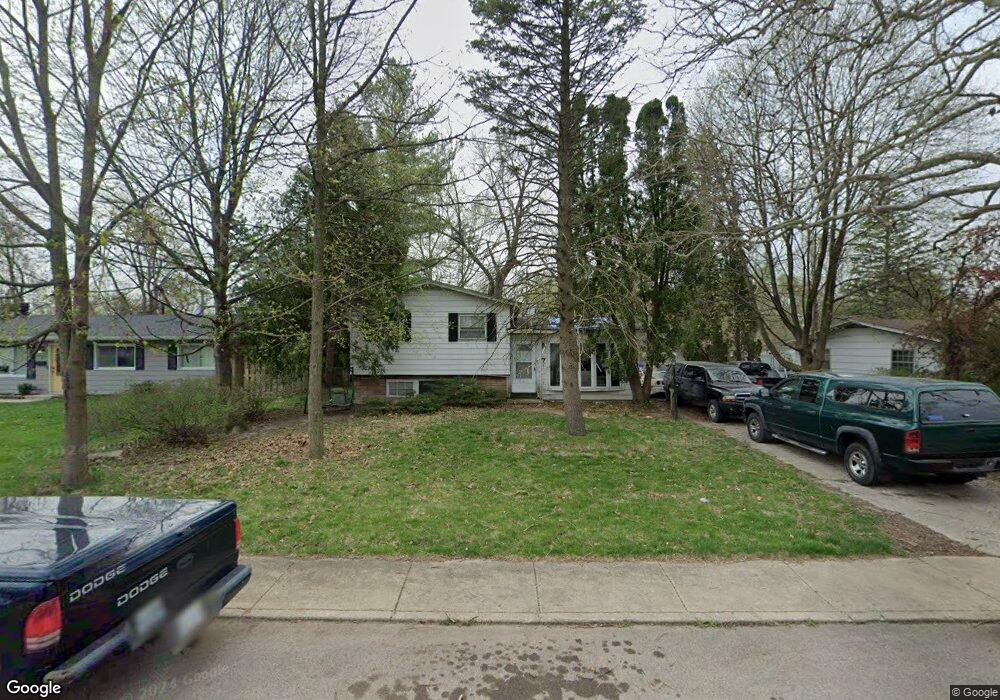
7 Durango Rd Montgomery, IL 60538
Boulder Hill NeighborhoodEstimated Value: $246,000 - $290,000
4
Beds
2
Baths
884
Sq Ft
$303/Sq Ft
Est. Value
About This Home
This home is located at 7 Durango Rd, Montgomery, IL 60538 and is currently estimated at $268,005, approximately $303 per square foot. 7 Durango Rd is a home located in Kendall County with nearby schools including Boulder Hill Elementary School, Thompson Jr. High School, and Oswego High School.
Ownership History
Date
Name
Owned For
Owner Type
Purchase Details
Closed on
Jan 19, 2018
Sold by
Snell Lisa Maureen
Bought by
Snell William Joe
Current Estimated Value
Purchase Details
Closed on
Aug 25, 2006
Sold by
Snell William J and Diehm Lawrence M
Bought by
Snell William J
Home Financials for this Owner
Home Financials are based on the most recent Mortgage that was taken out on this home.
Original Mortgage
$178,200
Outstanding Balance
$106,549
Interest Rate
6.59%
Mortgage Type
New Conventional
Estimated Equity
$161,456
Purchase Details
Closed on
Sep 27, 2001
Sold by
Frola Lyle J and Frola Mary A
Bought by
Snell William J and Diehm Lawrence M
Home Financials for this Owner
Home Financials are based on the most recent Mortgage that was taken out on this home.
Original Mortgage
$141,994
Interest Rate
6.99%
Mortgage Type
FHA
Purchase Details
Closed on
Sep 1, 1987
Create a Home Valuation Report for This Property
The Home Valuation Report is an in-depth analysis detailing your home's value as well as a comparison with similar homes in the area
Home Values in the Area
Average Home Value in this Area
Purchase History
| Date | Buyer | Sale Price | Title Company |
|---|---|---|---|
| Snell William Joe | -- | Attorney | |
| Snell William J | -- | Tristar Title Llc | |
| Snell William J | $144,000 | First American Title Ins Co | |
| -- | $69,500 | -- |
Source: Public Records
Mortgage History
| Date | Status | Borrower | Loan Amount |
|---|---|---|---|
| Open | Snell William J | $178,200 | |
| Closed | Snell William J | $141,994 |
Source: Public Records
Tax History
| Year | Tax Paid | Tax Assessment Tax Assessment Total Assessment is a certain percentage of the fair market value that is determined by local assessors to be the total taxable value of land and additions on the property. | Land | Improvement |
|---|---|---|---|---|
| 2024 | $6,232 | $78,734 | $23,403 | $55,331 |
| 2023 | $5,833 | $71,576 | $21,275 | $50,301 |
| 2022 | $5,833 | $65,666 | $19,518 | $46,148 |
| 2021 | $5,650 | $61,370 | $18,241 | $43,129 |
| 2020 | $5,487 | $59,009 | $17,539 | $41,470 |
| 2019 | $5,431 | $57,491 | $17,539 | $39,952 |
| 2018 | $5,023 | $52,460 | $16,004 | $36,456 |
| 2017 | $4,882 | $48,350 | $14,750 | $33,600 |
| 2016 | $4,545 | $44,358 | $13,532 | $30,826 |
| 2015 | $4,417 | $41,073 | $12,530 | $28,543 |
| 2014 | -- | $39,493 | $12,048 | $27,445 |
| 2013 | -- | $41,571 | $12,682 | $28,889 |
Source: Public Records
Map
Nearby Homes
- 28 Seneca Dr
- 20 Durango Rd
- 19 Wyndham Dr Unit 10
- 16 Spring Garden Dr
- 117 Boulder Hill Pass Unit 117
- 86 Circle Dr E
- 119 Garden Dr
- 4 Ingleshire Rd
- 22 Guilford Rd
- 1770 Fox Mead Ct
- 27 Winrock Rd
- 75 Winter Hill Cir
- 9 Cebold Dr
- 310 Fairwind Ct
- 109 Old Post Rd
- 122 Longbeach Rd
- 215 Fernwood Rd
- 74 Paddock St
- 5.43 B-3 Commercial State Route 31
- 6 E Anchor Dr
Your Personal Tour Guide
Ask me questions while you tour the home.