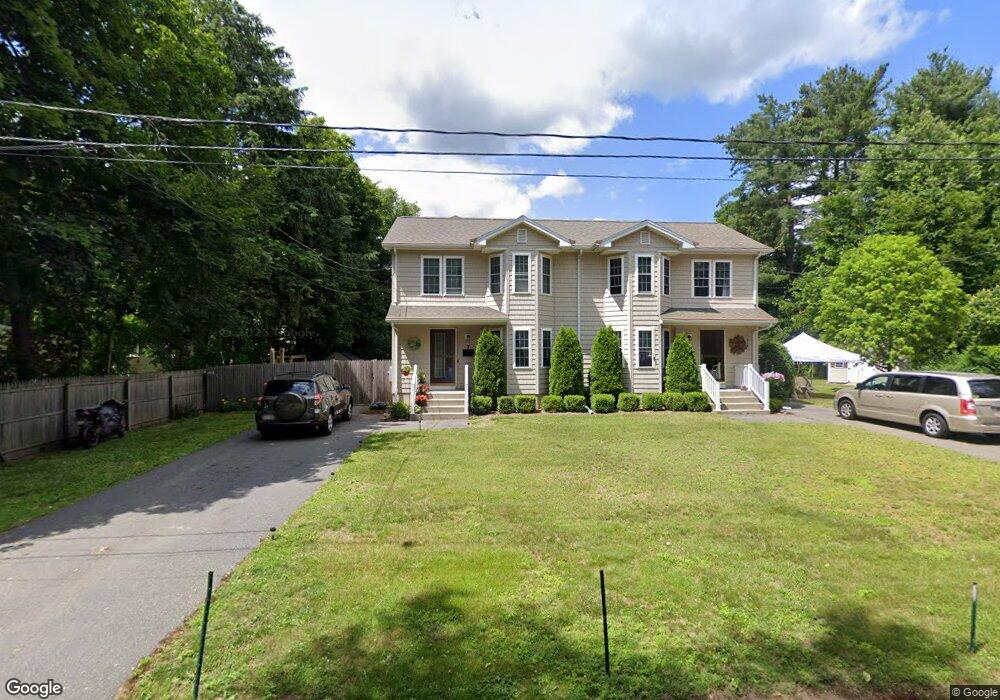
7 Edward Ave Easthampton, MA 01027
Estimated Value: $285,000 - $327,708
3
Beds
2
Baths
1,128
Sq Ft
$277/Sq Ft
Est. Value
About This Home
This home is located at 7 Edward Ave, Easthampton, MA 01027 and is currently estimated at $311,927, approximately $276 per square foot. 7 Edward Ave is a home located in Hampshire County with nearby schools including Easthampton High School, Hilltown Cooperative Charter Public School, and Tri-County Schools.
Ownership History
Date
Name
Owned For
Owner Type
Purchase Details
Closed on
Mar 15, 2023
Sold by
Hall Nerissa
Bought by
Salvatierra Perez A and Lamberto Kelly
Current Estimated Value
Home Financials for this Owner
Home Financials are based on the most recent Mortgage that was taken out on this home.
Original Mortgage
$263,150
Outstanding Balance
$253,621
Interest Rate
6.09%
Mortgage Type
Purchase Money Mortgage
Estimated Equity
$58,306
Purchase Details
Closed on
Jan 5, 2019
Sold by
Daserra Kristen V
Bought by
Hall Nerissa
Home Financials for this Owner
Home Financials are based on the most recent Mortgage that was taken out on this home.
Original Mortgage
$152,000
Interest Rate
4.8%
Mortgage Type
New Conventional
Purchase Details
Closed on
Aug 8, 2008
Sold by
Boucher John T and Boucher S
Bought by
Thrane Kristen Rae
Home Financials for this Owner
Home Financials are based on the most recent Mortgage that was taken out on this home.
Original Mortgage
$35,600
Interest Rate
6.49%
Mortgage Type
Purchase Money Mortgage
Purchase Details
Closed on
Aug 27, 2007
Sold by
Autumn Prop Llc
Bought by
Boucher John T
Home Financials for this Owner
Home Financials are based on the most recent Mortgage that was taken out on this home.
Original Mortgage
$47,500
Interest Rate
6.78%
Mortgage Type
Purchase Money Mortgage
Create a Home Valuation Report for This Property
The Home Valuation Report is an in-depth analysis detailing your home's value as well as a comparison with similar homes in the area
Home Values in the Area
Average Home Value in this Area
Purchase History
| Date | Buyer | Sale Price | Title Company |
|---|---|---|---|
| Salvatierra Perez A | $277,000 | None Available | |
| Hall Nerissa | $190,000 | -- | |
| Thrane Kristen Rae | $178,000 | -- | |
| Thrane Kristen Rae | $178,000 | -- | |
| Boucher John T | $180,000 | -- | |
| Boucher John T | $180,000 | -- |
Source: Public Records
Mortgage History
| Date | Status | Borrower | Loan Amount |
|---|---|---|---|
| Open | Salvatierra Perez A | $263,150 | |
| Previous Owner | Hall Nerissa | $152,000 | |
| Previous Owner | Thrane Kristen Rae | $35,600 | |
| Previous Owner | Boucher John T | $47,500 |
Source: Public Records
Tax History
| Year | Tax Paid | Tax Assessment Tax Assessment Total Assessment is a certain percentage of the fair market value that is determined by local assessors to be the total taxable value of land and additions on the property. | Land | Improvement |
|---|---|---|---|---|
| 2025 | $3,754 | $274,600 | $0 | $274,600 |
| 2024 | $3,494 | $257,700 | $0 | $257,700 |
| 2023 | $2,789 | $190,400 | $0 | $190,400 |
| 2022 | $3,147 | $190,400 | $0 | $190,400 |
| 2021 | $3,454 | $196,900 | $0 | $196,900 |
| 2020 | $3,382 | $190,400 | $0 | $190,400 |
| 2019 | $2,767 | $179,000 | $0 | $179,000 |
| 2018 | $2,733 | $170,800 | $0 | $170,800 |
| 2017 | $2,663 | $164,300 | $0 | $164,300 |
| 2016 | $2,588 | $166,000 | $0 | $166,000 |
| 2015 | $2,515 | $166,000 | $0 | $166,000 |
Source: Public Records
Map
Nearby Homes
- 10 Glen Cove Place Unit A
- 12 Glen Cove Place Unit B
- 33 Knipfer Ave
- 2 Oak St
- 7 Union Ct
- 4 Gaugh St
- 19 Nicols Way Unit 19
- 11 Dragon Cir
- 296 Old Wilson Rd
- 6 Wilton Rd
- M143 &152 Glendale St
- 385 Main St
- 967 Florence Rd
- 131 West St Unit 131
- 41 South St Unit 11
- 336 Main St
- 6 S St & Abutting Lots
- 18 Cedar St
- 641 Northampton St
- 2 W Park Dr
- 9 Edward Ave
- 7 Edward Ave
- 7 Edward Ave
- 7 Edward Ave Unit 7
- 3 Edward Ave
- 1 Edward Ave
- 1 Edward Ave
- 1 Edward Ave
- 74 Ferry St
- 11 Edward Ave
- 9 Boylston St
- 13 Boylston St Unit 2
- 5 Boylston St
- 11 Boylston St Unit 11
- 11 Boylston St Unit 13
- 3 Boylston St
- 25-29 Parsons St
- 76 Ferry St
- 62 Ferry St Unit 66
- 29 Parsons St Unit 2
Your Personal Tour Guide
Ask me questions while you tour the home.