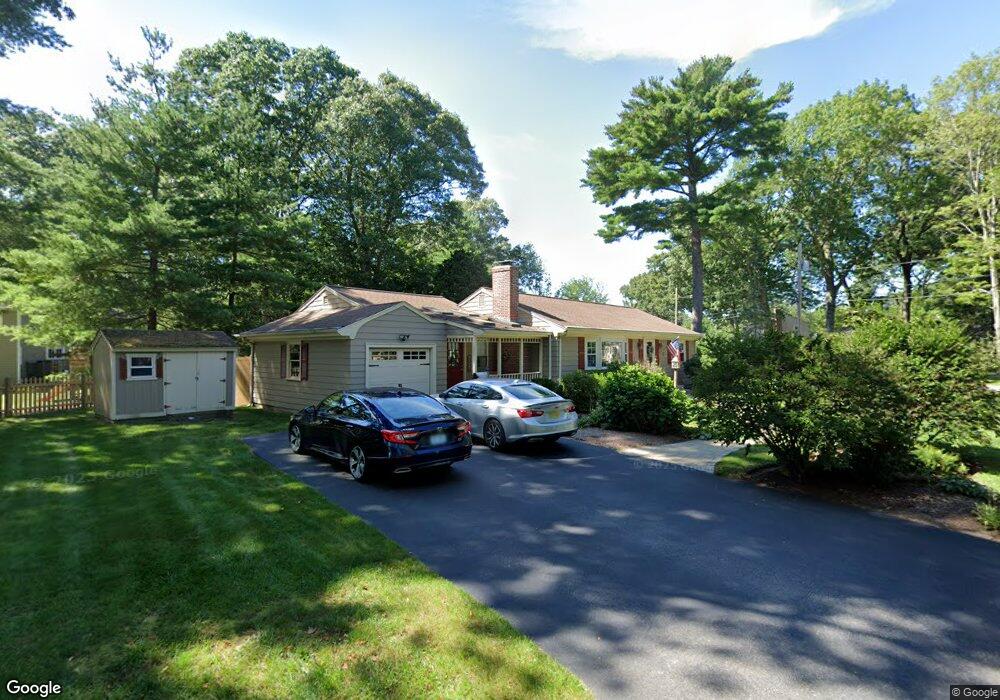
7 Ellis St Barrington, RI 02806
Hampden Meadows NeighborhoodEstimated Value: $681,230 - $799,000
3
Beds
2
Baths
1,661
Sq Ft
$443/Sq Ft
Est. Value
About This Home
This home is located at 7 Ellis St, Barrington, RI 02806 and is currently estimated at $735,808, approximately $442 per square foot. 7 Ellis St is a home located in Bristol County with nearby schools including Barrington High School, Barrington Christian Academy, and St. Andrews School.
Ownership History
Date
Name
Owned For
Owner Type
Purchase Details
Closed on
Apr 15, 2024
Sold by
Turtle William J and Turtle Jean M
Bought by
William James Turtle Lt and Turtle
Current Estimated Value
Purchase Details
Closed on
Mar 6, 1990
Sold by
Rodrigu Edgardo E C
Bought by
Turtle William J
Create a Home Valuation Report for This Property
The Home Valuation Report is an in-depth analysis detailing your home's value as well as a comparison with similar homes in the area
Home Values in the Area
Average Home Value in this Area
Purchase History
| Date | Buyer | Sale Price | Title Company |
|---|---|---|---|
| William James Turtle Lt | -- | None Available | |
| William James Turtle Lt | -- | None Available | |
| Turtle William J | $162,000 | -- | |
| Turtle William J | $162,000 | -- |
Source: Public Records
Mortgage History
| Date | Status | Borrower | Loan Amount |
|---|---|---|---|
| Previous Owner | Turtle William J | $150,000 | |
| Previous Owner | Turtle William J | $137,000 |
Source: Public Records
Tax History Compared to Growth
Tax History
| Year | Tax Paid | Tax Assessment Tax Assessment Total Assessment is a certain percentage of the fair market value that is determined by local assessors to be the total taxable value of land and additions on the property. | Land | Improvement |
|---|---|---|---|---|
| 2025 | $8,498 | $554,000 | $267,000 | $287,000 |
| 2024 | $8,172 | $554,000 | $267,000 | $287,000 |
| 2023 | $7,734 | $381,000 | $166,000 | $215,000 |
| 2022 | $7,487 | $381,000 | $166,000 | $215,000 |
| 2021 | $7,200 | $376,000 | $166,000 | $210,000 |
| 2020 | $6,981 | $334,000 | $144,000 | $190,000 |
| 2019 | $6,713 | $334,000 | $144,000 | $190,000 |
| 2018 | $6,513 | $334,000 | $144,000 | $190,000 |
| 2017 | $6,052 | $302,600 | $142,700 | $159,900 |
| 2016 | $5,583 | $302,600 | $142,700 | $159,900 |
| 2015 | $5,522 | $302,600 | $142,700 | $159,900 |
| 2014 | $5,904 | $322,600 | $142,700 | $179,900 |
Source: Public Records
Map
Nearby Homes