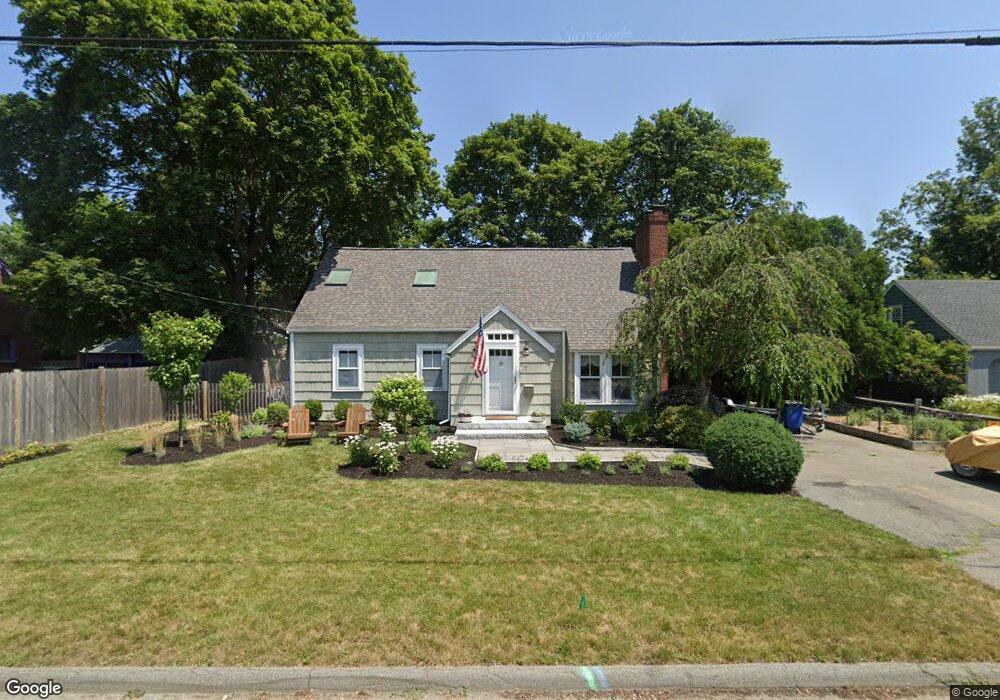
7 Euclid Ave Marblehead, MA 01945
Estimated Value: $838,738 - $1,038,000
2
Beds
2
Baths
1,822
Sq Ft
$517/Sq Ft
Est. Value
About This Home
This home is located at 7 Euclid Ave, Marblehead, MA 01945 and is currently estimated at $941,435, approximately $516 per square foot. 7 Euclid Ave is a home located in Essex County with nearby schools including Marblehead High School, Tower School, and Devereux School.
Ownership History
Date
Name
Owned For
Owner Type
Purchase Details
Closed on
Oct 15, 2004
Sold by
Siege Gregory and Siege Jacqueline J
Bought by
Haran Elizabeth M
Current Estimated Value
Home Financials for this Owner
Home Financials are based on the most recent Mortgage that was taken out on this home.
Original Mortgage
$200,000
Outstanding Balance
$98,886
Interest Rate
5.85%
Estimated Equity
$842,549
Purchase Details
Closed on
Mar 31, 2004
Sold by
Azevedo Fatima
Bought by
Azevedo Fatima Est and Azevedo
Purchase Details
Closed on
Dec 30, 1994
Sold by
Rosenberg David S and Rosenberg Karen
Bought by
Siege Gregory and Siege Jacqueline
Purchase Details
Closed on
Nov 21, 1991
Sold by
Brodie Barbara H and Brodie Heather
Bought by
Rosenberg David S and Rosenberg Karen S
Create a Home Valuation Report for This Property
The Home Valuation Report is an in-depth analysis detailing your home's value as well as a comparison with similar homes in the area
Home Values in the Area
Average Home Value in this Area
Purchase History
| Date | Buyer | Sale Price | Title Company |
|---|---|---|---|
| Haran Elizabeth M | $535,000 | -- | |
| Haran Elizabeth M | $535,000 | -- | |
| Azevedo Fatima Est | -- | -- | |
| Azevedo Fatima Est | -- | -- | |
| Siege Gregory | $232,500 | -- | |
| Siege Gregory | $232,500 | -- | |
| Rosenberg David S | $177,500 | -- | |
| Rosenberg David S | $177,500 | -- |
Source: Public Records
Mortgage History
| Date | Status | Borrower | Loan Amount |
|---|---|---|---|
| Open | Rosenberg David S | $200,000 | |
| Previous Owner | Rosenberg David S | $188,000 |
Source: Public Records
Tax History
| Year | Tax Paid | Tax Assessment Tax Assessment Total Assessment is a certain percentage of the fair market value that is determined by local assessors to be the total taxable value of land and additions on the property. | Land | Improvement |
|---|---|---|---|---|
| 2025 | $6,701 | $740,400 | $484,500 | $255,900 |
| 2024 | $6,052 | $675,400 | $508,700 | $166,700 |
| 2023 | $7,535 | $753,500 | $569,300 | $184,200 |
| 2022 | $6,635 | $630,700 | $448,200 | $182,500 |
| 2021 | $6,319 | $606,400 | $423,900 | $182,500 |
| 2020 | $6,030 | $580,400 | $423,900 | $156,500 |
| 2019 | $5,696 | $530,400 | $375,500 | $154,900 |
| 2018 | $5,578 | $506,200 | $351,300 | $154,900 |
| 2017 | $5,306 | $481,900 | $327,000 | $154,900 |
| 2016 | $4,959 | $446,800 | $302,800 | $144,000 |
| 2015 | $4,852 | $437,900 | $302,800 | $135,100 |
| 2014 | $4,620 | $416,600 | $290,700 | $125,900 |
Source: Public Records
Map
Nearby Homes
- 11 Angenica Terrace
- 12 Pickwick Rd
- 4 Dean Rd
- 212 Humphrey St Unit 205
- 33 W Shore Dr
- 48 Bellevue Rd
- 282 Pleasant St
- 4 Fairview Rd
- 70 Maverick St
- 28 Surrey Rd
- 106 Broadway Unit 3
- 23 Marion Rd Unit B
- 1002 Paradise Rd Unit PHE
- 326 Lafayette St Unit 2
- 30 Haley Rd Unit 1
- 24 Wisteria St Unit 2
- 1004 Paradise Rd Unit 1L
- 1 Shore Ave
- 29 Ocean Ave Unit 4
- 2 Ocean Ave
Your Personal Tour Guide
Ask me questions while you tour the home.