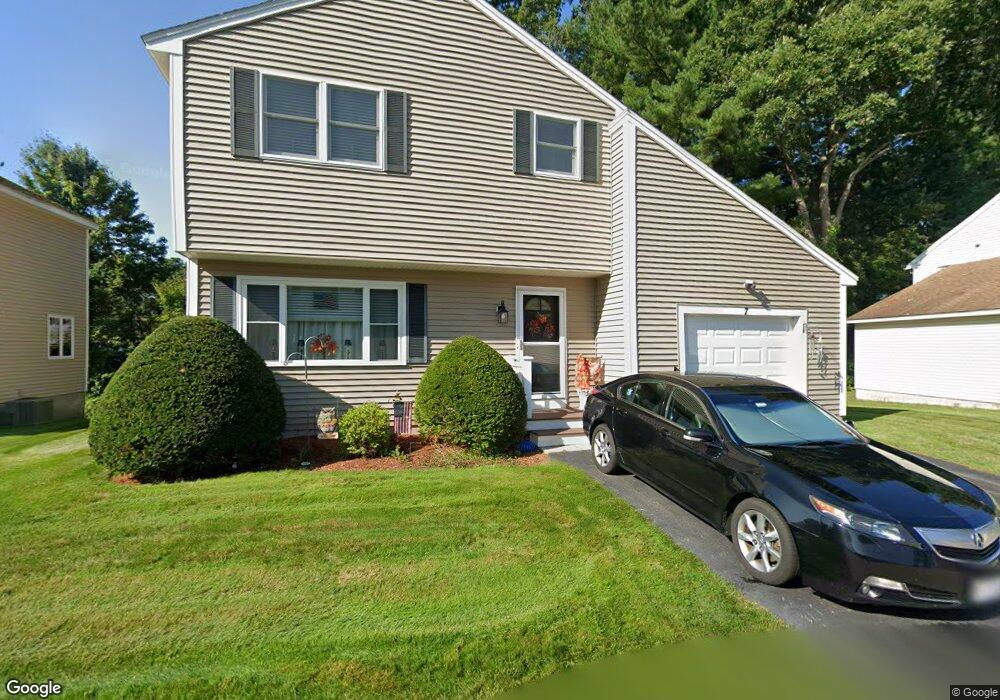
7 Falls Grove Rd Unit U110 Nashua, NH 03063
Northwest Nashua NeighborhoodEstimated Value: $450,000 - $504,000
3
Beds
2
Baths
1,862
Sq Ft
$257/Sq Ft
Est. Value
About This Home
This home is located at 7 Falls Grove Rd Unit U110, Nashua, NH 03063 and is currently estimated at $478,035, approximately $256 per square foot. 7 Falls Grove Rd Unit U110 is a home located in Hillsborough County with nearby schools including Broad Street Elementary School, Elm Street Middle School, and Nashua High School North.
Ownership History
Date
Name
Owned For
Owner Type
Purchase Details
Closed on
Jul 22, 2019
Sold by
Shaw Steven R and Shaw Linda M
Bought by
Shaw Ret
Current Estimated Value
Purchase Details
Closed on
Jun 1, 1999
Sold by
Spagnuolo Patricia A
Bought by
Shaw Steven R and Shaw Linda M
Home Financials for this Owner
Home Financials are based on the most recent Mortgage that was taken out on this home.
Original Mortgage
$129,640
Interest Rate
6.82%
Create a Home Valuation Report for This Property
The Home Valuation Report is an in-depth analysis detailing your home's value as well as a comparison with similar homes in the area
Home Values in the Area
Average Home Value in this Area
Purchase History
| Date | Buyer | Sale Price | Title Company |
|---|---|---|---|
| Shaw Ret | -- | -- | |
| Shaw Steven R | $134,900 | -- |
Source: Public Records
Mortgage History
| Date | Status | Borrower | Loan Amount |
|---|---|---|---|
| Previous Owner | Shaw Steven R | $129,640 |
Source: Public Records
Tax History Compared to Growth
Tax History
| Year | Tax Paid | Tax Assessment Tax Assessment Total Assessment is a certain percentage of the fair market value that is determined by local assessors to be the total taxable value of land and additions on the property. | Land | Improvement |
|---|---|---|---|---|
| 2024 | $7,031 | $442,200 | $0 | $442,200 |
| 2023 | $6,576 | $360,700 | $0 | $360,700 |
| 2022 | $6,518 | $360,700 | $0 | $360,700 |
| 2021 | $5,777 | $248,800 | $0 | $248,800 |
| 2020 | $5,621 | $248,600 | $0 | $248,600 |
| 2019 | $5,410 | $248,600 | $0 | $248,600 |
| 2018 | $5,273 | $248,600 | $0 | $248,600 |
| 2017 | $5,233 | $202,900 | $0 | $202,900 |
| 2016 | $5,087 | $202,900 | $0 | $202,900 |
| 2015 | $4,977 | $202,900 | $0 | $202,900 |
| 2014 | $4,880 | $202,900 | $0 | $202,900 |
Source: Public Records
Map
Nearby Homes
- 27 Country Hill Rd Unit U90
- 4 Nelson St
- 3 Richmond St
- 5 Meghan Dr Unit U23
- 46 Scenic Dr
- 6 Cornwall Ln Unit 7
- 11 Inca Dr
- 599 W Hollis St
- 76 Bartemus Trail Unit U231
- 11 Bartemus Trail Unit 204
- 14 Parrish Hill Dr
- 40 Spring Cove Rd Unit U117
- 22 Cathedral Cir
- 424 Broad St
- 12 Spring Cove Rd Unit U103
- 20 Martha St
- 47 Dogwood Dr Unit U202
- 8 Althea Ln Unit U26
- 334 Broad St
- 16 Laurel Ct Unit U320
- 9 Falls Grove Rd Unit U111
- 5 Falls Grove Rd Unit U109
- 18 Cheshire St
- 6 Falls Grove Rd Unit U115
- 8 Falls Grove Rd Unit U114
- 11 Falls Grove Rd Unit U112
- 4 Falls Grove Rd Unit U116
- 3 Falls Grove Rd Unit U108
- 20 Cheshire St
- 11 Brussels Dr Unit U121
- 15 Falls Grove Rd Unit U113
- 15 Brussels Dr Unit U122
- 16 Cheshire St
- 22 Cheshire St
- 4 Fenwick St Unit U107
- 17 Brussels Dr Unit U123
- 3 Fenwick St Unit U93
- 31 Country Hill Rd Unit U92
- 9 Brussels Dr Unit U120
- 29 Country Hill Rd Unit U91