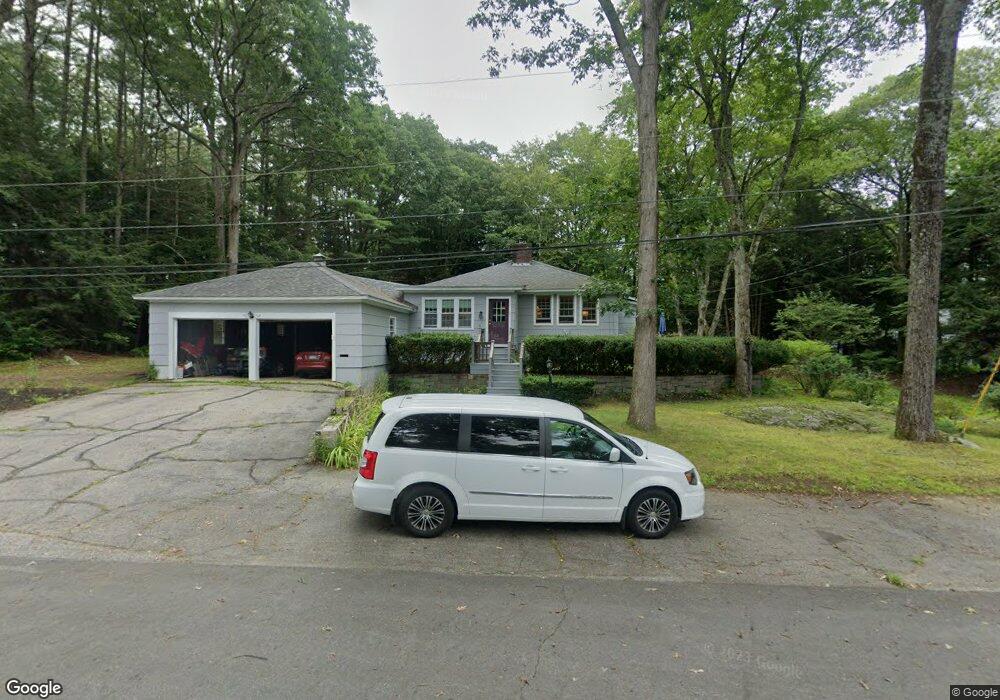
7 Fernrock St Concord, NH 03301
South End NeighborhoodEstimated Value: $566,387 - $726,000
4
Beds
2
Baths
2,246
Sq Ft
$286/Sq Ft
Est. Value
About This Home
This home is located at 7 Fernrock St, Concord, NH 03301 and is currently estimated at $642,097, approximately $285 per square foot. 7 Fernrock St is a home located in Merrimack County with nearby schools including Abbot-Downing School, Rundlett Middle School, and Concord High School.
Ownership History
Date
Name
Owned For
Owner Type
Purchase Details
Closed on
May 9, 2012
Sold by
Landsman Margaret S
Bought by
Margaret S Landsman T S and Margaret Landsman
Current Estimated Value
Purchase Details
Closed on
Apr 26, 1991
Bought by
Winer Steven and Landsman Margaret
Create a Home Valuation Report for This Property
The Home Valuation Report is an in-depth analysis detailing your home's value as well as a comparison with similar homes in the area
Home Values in the Area
Average Home Value in this Area
Purchase History
| Date | Buyer | Sale Price | Title Company |
|---|---|---|---|
| Margaret S Landsman T S | -- | -- | |
| Landsman Margaret S | -- | -- | |
| Winer Steven | $160,000 | -- |
Source: Public Records
Tax History Compared to Growth
Tax History
| Year | Tax Paid | Tax Assessment Tax Assessment Total Assessment is a certain percentage of the fair market value that is determined by local assessors to be the total taxable value of land and additions on the property. | Land | Improvement |
|---|---|---|---|---|
| 2024 | $10,345 | $373,600 | $139,400 | $234,200 |
| 2023 | $10,035 | $373,600 | $139,400 | $234,200 |
| 2022 | $9,673 | $373,600 | $139,400 | $234,200 |
| 2021 | $9,327 | $371,300 | $139,400 | $231,900 |
| 2020 | $8,973 | $335,300 | $109,600 | $225,700 |
| 2019 | $9,040 | $325,400 | $114,000 | $211,400 |
| 2018 | $9,029 | $320,300 | $114,400 | $205,900 |
| 2017 | $8,833 | $312,800 | $114,400 | $198,400 |
| 2016 | $8,445 | $305,200 | $112,200 | $193,000 |
| 2015 | $8,240 | $293,700 | $121,800 | $171,900 |
| 2014 | $7,874 | $293,700 | $121,800 | $171,900 |
| 2013 | -- | $287,600 | $121,800 | $165,800 |
| 2012 | -- | $279,600 | $128,300 | $151,300 |
Source: Public Records
Map
Nearby Homes