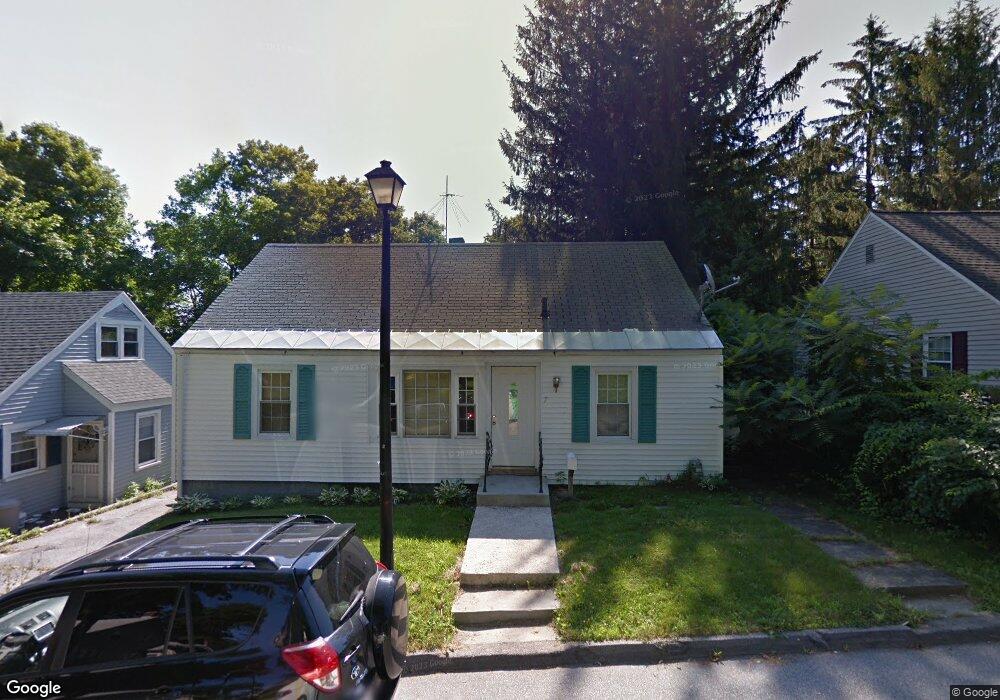
7 Field Way Worcester, MA 01602
Newton Square NeighborhoodEstimated Value: $226,000 - $435,000
3
Beds
3
Baths
900
Sq Ft
$348/Sq Ft
Est. Value
About This Home
This home is located at 7 Field Way, Worcester, MA 01602 and is currently estimated at $313,536, approximately $348 per square foot. 7 Field Way is a home located in Worcester County with nearby schools including Chandler Magnet, Jacob Hiatt Magnet School, and Midland Street.
Ownership History
Date
Name
Owned For
Owner Type
Purchase Details
Closed on
Jul 14, 2025
Sold by
Connolly Michael
Bought by
Gunning Nancy J
Current Estimated Value
Home Financials for this Owner
Home Financials are based on the most recent Mortgage that was taken out on this home.
Original Mortgage
$150,000
Outstanding Balance
$149,493
Interest Rate
6.89%
Mortgage Type
New Conventional
Estimated Equity
$164,043
Purchase Details
Closed on
Feb 13, 2025
Sold by
Cook Lisa Beth Est and Cook
Bought by
Connolly Michael
Purchase Details
Closed on
Feb 16, 2001
Sold by
Dixon Robert F and Dixon Erin M
Bought by
Cook Lisa B
Home Financials for this Owner
Home Financials are based on the most recent Mortgage that was taken out on this home.
Original Mortgage
$115,090
Interest Rate
7.08%
Mortgage Type
Purchase Money Mortgage
Purchase Details
Closed on
Jul 17, 1998
Sold by
Buckley Julie Ann and Roy Robert J
Bought by
Dixon Robert F and Hughes Erin M
Purchase Details
Closed on
Mar 28, 1997
Sold by
Parella Lillian Est and Harris
Bought by
Buckley Julie A
Create a Home Valuation Report for This Property
The Home Valuation Report is an in-depth analysis detailing your home's value as well as a comparison with similar homes in the area
Home Values in the Area
Average Home Value in this Area
Purchase History
| Date | Buyer | Sale Price | Title Company |
|---|---|---|---|
| Gunning Nancy J | $395,000 | -- | |
| Gunning Nancy J | $395,000 | -- | |
| Connolly Michael | $220,000 | None Available | |
| Connolly Michael | $220,000 | None Available | |
| Cook Lisa B | $116,000 | -- | |
| Cook Lisa B | $116,000 | -- | |
| Dixon Robert F | $98,000 | -- | |
| Dixon Robert F | $98,000 | -- | |
| Buckley Julie A | $68,000 | -- | |
| Buckley Julie A | $68,000 | -- |
Source: Public Records
Mortgage History
| Date | Status | Borrower | Loan Amount |
|---|---|---|---|
| Open | Gunning Nancy J | $150,000 | |
| Closed | Gunning Nancy J | $150,000 | |
| Previous Owner | Buckley Julie A | $144,000 | |
| Previous Owner | Buckley Julie A | $115,090 |
Source: Public Records
Tax History
| Year | Tax Paid | Tax Assessment Tax Assessment Total Assessment is a certain percentage of the fair market value that is determined by local assessors to be the total taxable value of land and additions on the property. | Land | Improvement |
|---|---|---|---|---|
| 2025 | $3,978 | $301,600 | $117,600 | $184,000 |
| 2024 | $3,923 | $285,300 | $117,600 | $167,700 |
| 2023 | $3,769 | $262,800 | $102,300 | $160,500 |
| 2022 | $3,326 | $218,700 | $81,800 | $136,900 |
| 2021 | $3,155 | $193,800 | $65,400 | $128,400 |
| 2020 | $3,060 | $180,000 | $65,500 | $114,500 |
| 2019 | $2,880 | $160,000 | $58,900 | $101,100 |
| 2018 | $2,818 | $149,000 | $58,900 | $90,100 |
| 2017 | $2,825 | $147,000 | $58,900 | $88,100 |
| 2016 | $2,685 | $130,300 | $42,800 | $87,500 |
| 2015 | $2,615 | $130,300 | $42,800 | $87,500 |
| 2014 | $2,546 | $130,300 | $42,800 | $87,500 |
Source: Public Records
Map
Nearby Homes
Your Personal Tour Guide
Ask me questions while you tour the home.