7 Ford Rd Howell, NJ 07731
Southard NeighborhoodEstimated Value: $564,027 - $607,000
2
Beds
1
Bath
1,152
Sq Ft
$508/Sq Ft
Est. Value
About This Home
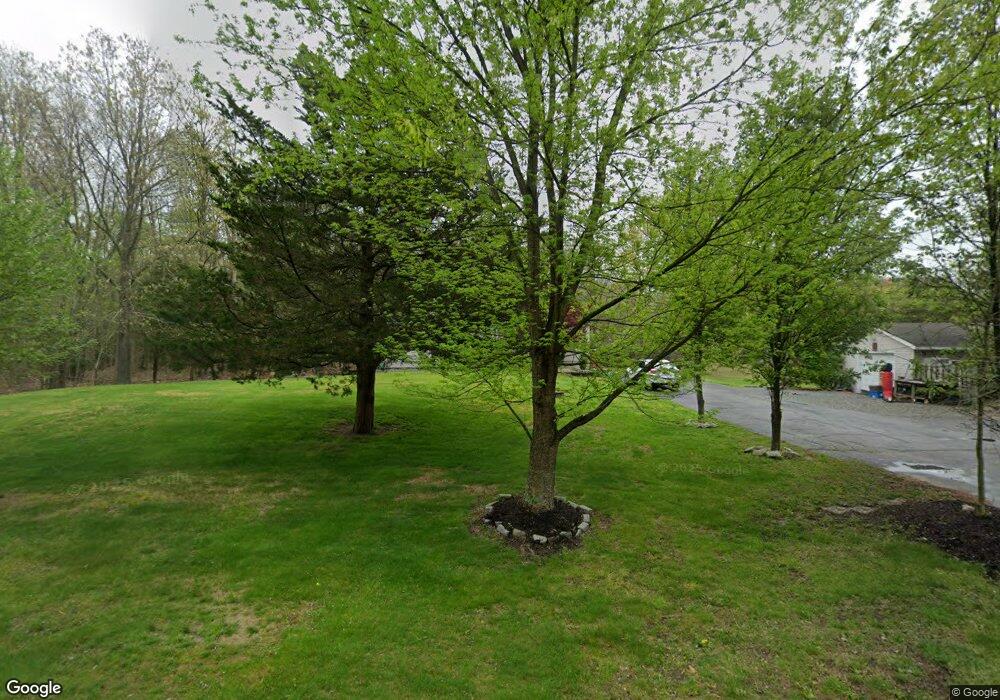
This home is located at 7 Ford Rd, Howell, NJ 07731 and is currently estimated at $585,007, approximately $507 per square foot. 7 Ford Rd is a home located in Monmouth County with nearby schools including Taunton School, Aldrich School, and Howell Township Middle School South.
Ownership History
Date
Name
Owned For
Owner Type
Purchase Details
Closed on
Apr 29, 2025
Sold by
Pedulla Richard and Pedulla Sharon L
Bought by
Bilinsky Samuel and Bilinsky Esther
Current Estimated Value
Home Financials for this Owner
Home Financials are based on the most recent Mortgage that was taken out on this home.
Original Mortgage
$431,250
Outstanding Balance
$428,173
Interest Rate
6.67%
Mortgage Type
New Conventional
Estimated Equity
$156,834
Purchase Details
Closed on
Mar 30, 2000
Sold by
Paul Eugene
Bought by
Pedulla Ricahrd and Pedulla Sharon
Home Financials for this Owner
Home Financials are based on the most recent Mortgage that was taken out on this home.
Original Mortgage
$145,000
Interest Rate
8.23%
Create a Home Valuation Report for This Property
The Home Valuation Report is an in-depth analysis detailing your home's value as well as a comparison with similar homes in the area
Home Values in the Area
Average Home Value in this Area
Purchase History
| Date | Buyer | Sale Price | Title Company |
|---|---|---|---|
| Bilinsky Samuel | $575,000 | None Listed On Document | |
| Pedulla Ricahrd | $50,000 | -- |
Source: Public Records
Mortgage History
| Date | Status | Borrower | Loan Amount |
|---|---|---|---|
| Open | Bilinsky Samuel | $431,250 | |
| Previous Owner | Pedulla Ricahrd | $145,000 |
Source: Public Records
Tax History
| Year | Tax Paid | Tax Assessment Tax Assessment Total Assessment is a certain percentage of the fair market value that is determined by local assessors to be the total taxable value of land and additions on the property. | Land | Improvement |
|---|---|---|---|---|
| 2025 | $7,484 | $521,000 | $286,400 | $234,600 |
| 2024 | $7,156 | $420,900 | $190,600 | $230,300 |
| 2023 | $7,156 | $384,500 | $159,600 | $224,900 |
| 2022 | $7,258 | $338,200 | $138,500 | $199,700 |
| 2021 | $7,258 | $316,100 | $138,500 | $177,600 |
| 2020 | $7,344 | $316,300 | $138,500 | $177,800 |
| 2019 | $7,377 | $311,800 | $135,000 | $176,800 |
| 2018 | $6,762 | $284,000 | $113,300 | $170,700 |
| 2017 | $6,853 | $284,600 | $113,300 | $171,300 |
| 2016 | $6,678 | $274,600 | $107,600 | $167,000 |
| 2015 | $7,179 | $292,200 | $127,600 | $164,600 |
| 2014 | $6,432 | $242,900 | $107,600 | $135,300 |
Source: Public Records
Map
Nearby Homes
- 80 Church Rd
- 29 Sweet Gum Rd
- 41 Sweet Gum Rd
- 47 Sweet Gum Rd
- 53 Sweet Gum Rd
- 9 Hawk Ct
- 57 Church Rd
- 284 Friendship Rd
- 4 Cherry Tree Cir
- 23 Sami Dr
- 44 Cherry Tree Cir
- 8 Trinity Place
- 231 Friendship Rd
- 901 Bethel Church Rd
- 42 Brown Rd
- 13 Dunbarton Rd
- 15 Standish Dr
- 13 Heritage Dr
- 3 Colorado Dr
- 40 Brookwood Pkwy
Your Personal Tour Guide
Ask me questions while you tour the home.