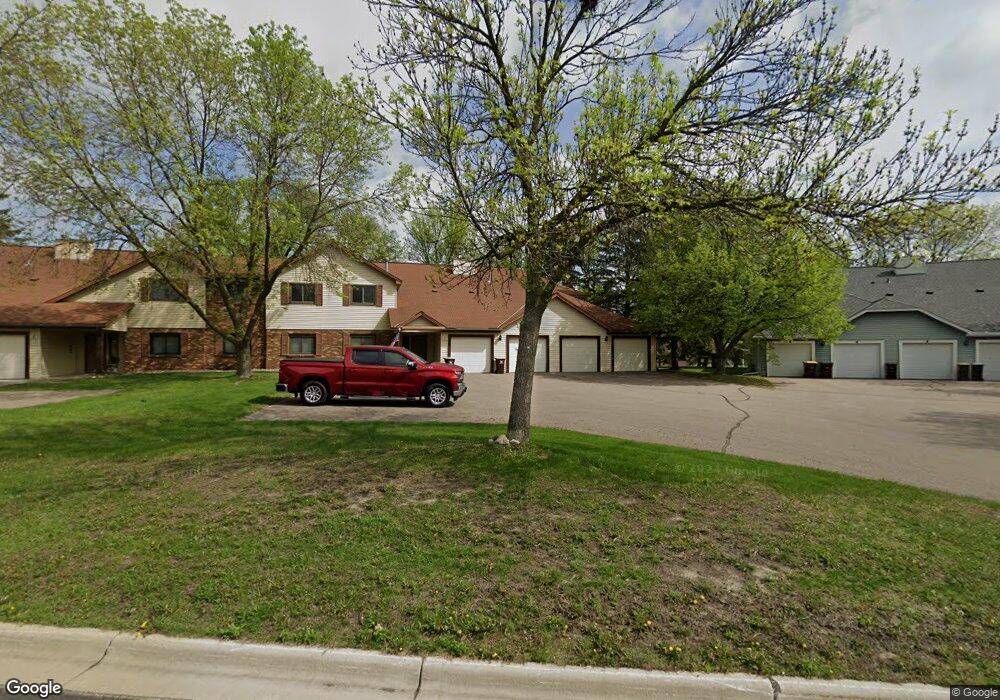
7 Fox Ridge Ct West St. Paul, MN 55118
Estimated Value: $179,003 - $189,000
2
Beds
1
Bath
1,000
Sq Ft
$184/Sq Ft
Est. Value
About This Home
This home is located at 7 Fox Ridge Ct, West St. Paul, MN 55118 and is currently estimated at $184,251, approximately $184 per square foot. 7 Fox Ridge Ct is a home located in Dakota County with nearby schools including Garlough Environmental Magnet, Friendly Hills Middle School, and Two Rivers High School.
Ownership History
Date
Name
Owned For
Owner Type
Purchase Details
Closed on
Oct 9, 2024
Sold by
Thrasher Carol
Bought by
Hofheins Joanna
Current Estimated Value
Home Financials for this Owner
Home Financials are based on the most recent Mortgage that was taken out on this home.
Original Mortgage
$100,000
Outstanding Balance
$98,949
Interest Rate
6.35%
Mortgage Type
New Conventional
Estimated Equity
$85,302
Purchase Details
Closed on
Dec 30, 2019
Sold by
Dunfee Rebecca
Bought by
Thrasher Carol J
Purchase Details
Closed on
Jul 15, 2015
Sold by
Kennedy Agnes L
Bought by
Dunfee Rebecca
Home Financials for this Owner
Home Financials are based on the most recent Mortgage that was taken out on this home.
Original Mortgage
$92,150
Interest Rate
4.02%
Mortgage Type
New Conventional
Purchase Details
Closed on
Mar 21, 2008
Sold by
Iverson Bruce A
Bought by
Kennedy Agnes
Purchase Details
Closed on
Sep 27, 1999
Sold by
Schmidt Albrecht Dorothy M
Bought by
Iverson Bruce A and Iverson Cheryl A
Create a Home Valuation Report for This Property
The Home Valuation Report is an in-depth analysis detailing your home's value as well as a comparison with similar homes in the area
Home Values in the Area
Average Home Value in this Area
Purchase History
| Date | Buyer | Sale Price | Title Company |
|---|---|---|---|
| Hofheins Joanna | $180,000 | -- | |
| Thrasher Carol J | $159,000 | Burnet Title | |
| Dunfee Rebecca | $97,000 | Home Title Inc | |
| Kennedy Agnes | $132,000 | -- | |
| Iverson Bruce A | $86,000 | -- |
Source: Public Records
Mortgage History
| Date | Status | Borrower | Loan Amount |
|---|---|---|---|
| Open | Hofheins Joanna | $100,000 | |
| Previous Owner | Dunfee Rebecca | $92,150 |
Source: Public Records
Tax History Compared to Growth
Tax History
| Year | Tax Paid | Tax Assessment Tax Assessment Total Assessment is a certain percentage of the fair market value that is determined by local assessors to be the total taxable value of land and additions on the property. | Land | Improvement |
|---|---|---|---|---|
| 2024 | $2,044 | $177,800 | $17,500 | $160,300 |
| 2023 | $2,044 | $182,800 | $18,000 | $164,800 |
| 2022 | $1,662 | $161,100 | $15,900 | $145,200 |
| 2021 | $1,572 | $147,400 | $14,500 | $132,900 |
| 2020 | $1,462 | $140,100 | $13,800 | $126,300 |
| 2019 | $1,624 | $129,300 | $12,700 | $116,600 |
| 2018 | $1,265 | $124,600 | $12,500 | $112,100 |
| 2017 | $958 | $104,300 | $10,400 | $93,900 |
| 2016 | $824 | $89,800 | $9,000 | $80,800 |
| 2015 | $779 | $51,050 | $5,105 | $45,945 |
| 2014 | -- | $48,434 | $4,868 | $43,566 |
| 2013 | -- | $40,980 | $4,080 | $36,900 |
Source: Public Records
Map
Nearby Homes
- 8XX Humboldt Ave
- 25 W Kraft Rd
- 1694 Humboldt Ave
- 2012 Pine Ridge Dr
- 180 Wentworth Ave W Unit E
- 170 Wentworth Ave W Unit F
- 48 Thompson Ave W Unit 40
- 1620 Charlton St Unit 109
- 1450 Bidwell St Unit 110
- Capri Plan at Thompson Square East
- Barcelona Plan at Thompson Square East
- Athens Plan at Thompson Square East
- Athens II Plan at Thompson Square East
- Bayfield Plan at Thompson Square East
- Hayward Plan at Thompson Square East
- 1531 Traverse Ln
- 362 Trenton Ln
- 1518 Traverse Ln
- 358 Trenton Ln
- 1537 Traverse Ln
- 7 Fox Ridge Ct Unit 708A
- 7 Fox Ridge Ct Unit 707D
- 7 Fox Ridge Ct Unit 706B
- 7 Fox Ridge Ct Unit 705C
- 5 Fox Ridge Ct Unit 704A
- 5 Fox Ridge Ct Unit 703C
- 5 Fox Ridge Ct Unit 702A
- 5 Fox Ridge Ct Unit 701D
- 5 Fox Ridge Ct Unit D
- 7 Fox Ridge Ct Unit C
- 5 Fox Ridge Ct Unit B
- 7 Fox Ridge Ct Unit B
- 5 Fox Ridge Ct Unit A
- 33 Fox Ridge Ct
- 55 Fox Ridge Ct
- 3 Fox Ridge Ct
- 77 Fox Ridge Ct
- 14 Marie Ave W
- 13 Fox Ridge Ct Unit A
- 13 Fox Ridge Ct Unit D