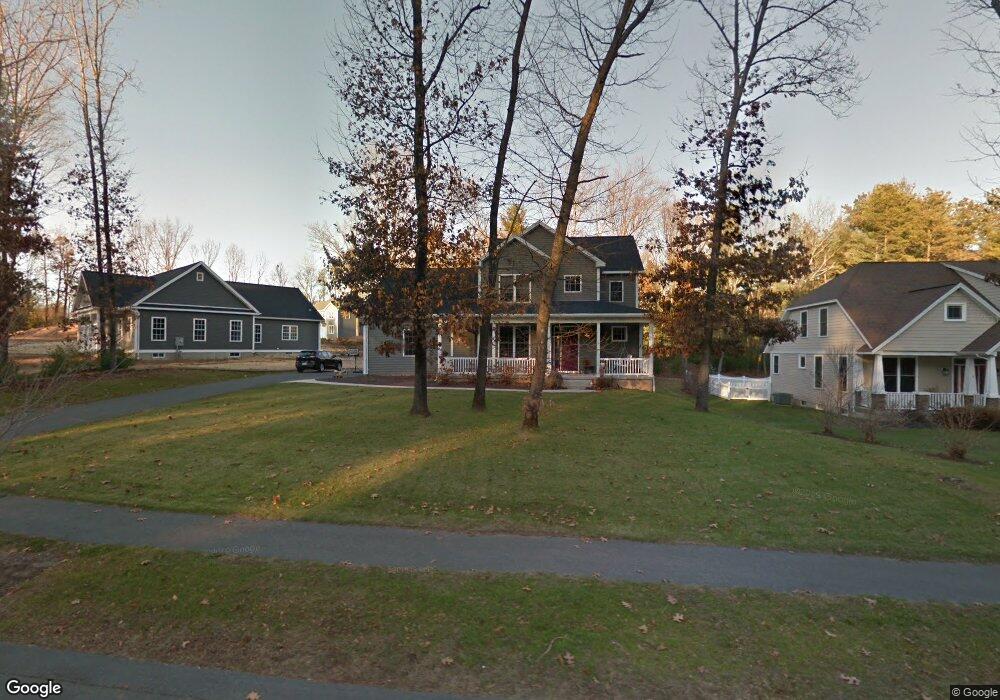
7 Fox Run Easthampton, MA 01027
Estimated Value: $676,000 - $951,000
3
Beds
3
Baths
2,140
Sq Ft
$375/Sq Ft
Est. Value
About This Home
This home is located at 7 Fox Run, Easthampton, MA 01027 and is currently estimated at $803,320, approximately $375 per square foot. 7 Fox Run is a home located in Hampshire County with nearby schools including Easthampton High School, Calvary Baptist Christian School, and Tri-County Schools.
Ownership History
Date
Name
Owned For
Owner Type
Purchase Details
Closed on
Nov 30, 2011
Sold by
Contract David A Hardy
Bought by
Roberts Frank L and Roberts Elizabeth R
Current Estimated Value
Home Financials for this Owner
Home Financials are based on the most recent Mortgage that was taken out on this home.
Original Mortgage
$373,500
Outstanding Balance
$256,601
Interest Rate
4.1%
Mortgage Type
Purchase Money Mortgage
Estimated Equity
$546,719
Create a Home Valuation Report for This Property
The Home Valuation Report is an in-depth analysis detailing your home's value as well as a comparison with similar homes in the area
Home Values in the Area
Average Home Value in this Area
Purchase History
| Date | Buyer | Sale Price | Title Company |
|---|---|---|---|
| Roberts Frank L | $415,500 | -- |
Source: Public Records
Mortgage History
| Date | Status | Borrower | Loan Amount |
|---|---|---|---|
| Open | Roberts Frank L | $373,500 |
Source: Public Records
Tax History
| Year | Tax Paid | Tax Assessment Tax Assessment Total Assessment is a certain percentage of the fair market value that is determined by local assessors to be the total taxable value of land and additions on the property. | Land | Improvement |
|---|---|---|---|---|
| 2025 | $10,192 | $745,600 | $132,200 | $613,400 |
| 2024 | $10,026 | $739,400 | $128,300 | $611,100 |
| 2023 | $6,297 | $429,800 | $101,400 | $328,400 |
| 2022 | $7,105 | $429,800 | $101,400 | $328,400 |
| 2021 | $7,847 | $447,400 | $101,400 | $346,000 |
| 2020 | $7,633 | $429,800 | $101,400 | $328,400 |
| 2019 | $6,795 | $439,500 | $118,200 | $321,300 |
| 2018 | $6,174 | $385,900 | $111,500 | $274,400 |
| 2017 | $6,024 | $371,600 | $107,100 | $264,500 |
| 2016 | $5,923 | $379,900 | $107,100 | $272,800 |
| 2015 | $5,755 | $379,900 | $107,100 | $272,800 |
Source: Public Records
Map
Nearby Homes
Your Personal Tour Guide
Ask me questions while you tour the home.