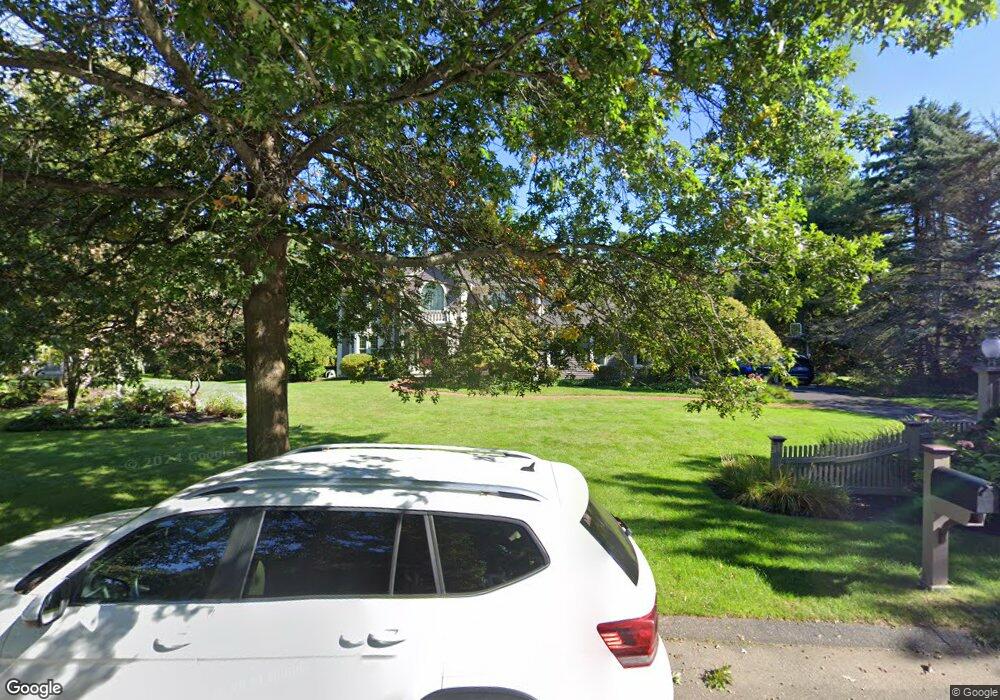
7 Fox Run Ln Lexington, MA 02420
Munroe Hill NeighborhoodEstimated Value: $2,646,516 - $3,023,000
4
Beds
6
Baths
3,813
Sq Ft
$741/Sq Ft
Est. Value
About This Home
This home is located at 7 Fox Run Ln, Lexington, MA 02420 and is currently estimated at $2,826,879, approximately $741 per square foot. 7 Fox Run Ln is a home located in Middlesex County with nearby schools including Fiske Elementary School, William Diamond Middle School, and Lexington High School.
Ownership History
Date
Name
Owned For
Owner Type
Purchase Details
Closed on
May 22, 1997
Sold by
Diamond West Dev Corp
Bought by
Burns David L and Moskos Margo M
Current Estimated Value
Create a Home Valuation Report for This Property
The Home Valuation Report is an in-depth analysis detailing your home's value as well as a comparison with similar homes in the area
Home Values in the Area
Average Home Value in this Area
Purchase History
| Date | Buyer | Sale Price | Title Company |
|---|---|---|---|
| Burns David L | $890,000 | -- |
Source: Public Records
Mortgage History
| Date | Status | Borrower | Loan Amount |
|---|---|---|---|
| Open | Burns David L | $680,000 | |
| Closed | Burns David L | $200,000 | |
| Closed | Burns David L | $490,000 |
Source: Public Records
Tax History Compared to Growth
Tax History
| Year | Tax Paid | Tax Assessment Tax Assessment Total Assessment is a certain percentage of the fair market value that is determined by local assessors to be the total taxable value of land and additions on the property. | Land | Improvement |
|---|---|---|---|---|
| 2025 | $30,147 | $2,465,000 | $960,000 | $1,505,000 |
| 2024 | $28,751 | $2,347,000 | $914,000 | $1,433,000 |
| 2023 | $27,261 | $2,097,000 | $831,000 | $1,266,000 |
| 2022 | $26,372 | $1,911,000 | $755,000 | $1,156,000 |
| 2021 | $27,125 | $1,885,000 | $749,000 | $1,136,000 |
| 2020 | $25,150 | $1,790,000 | $749,000 | $1,041,000 |
| 2019 | $24,428 | $1,730,000 | $714,000 | $1,016,000 |
| 2018 | $23,280 | $1,628,000 | $679,000 | $949,000 |
| 2017 | $23,227 | $1,603,000 | $647,000 | $956,000 |
| 2016 | $23,740 | $1,626,000 | $617,000 | $1,009,000 |
| 2015 | $22,483 | $1,513,000 | $560,000 | $953,000 |
| 2014 | $20,659 | $1,332,000 | $509,000 | $823,000 |
Source: Public Records
Map
Nearby Homes
- 23 Thoreau Rd
- 49 Duren Ave
- 23 Burroughs Rd
- 1 Maureen Rd
- 6 Maureen Rd
- 162 North St
- 14 Liana St
- 2 Howard Ct
- 3 Brown Rd
- 92 Muller Rd
- 71 Webb St
- 14 Saw Mill Brook Way
- 500 Lexington St Unit 6
- 15 Peachtree Rd
- 21 Derby Dr Unit 21
- 197 Woburn St
- 16 Winning Farm Rd Unit 16
- 15 Crescent Rd
- 8 Blueberry Ln
- 36 Adams St