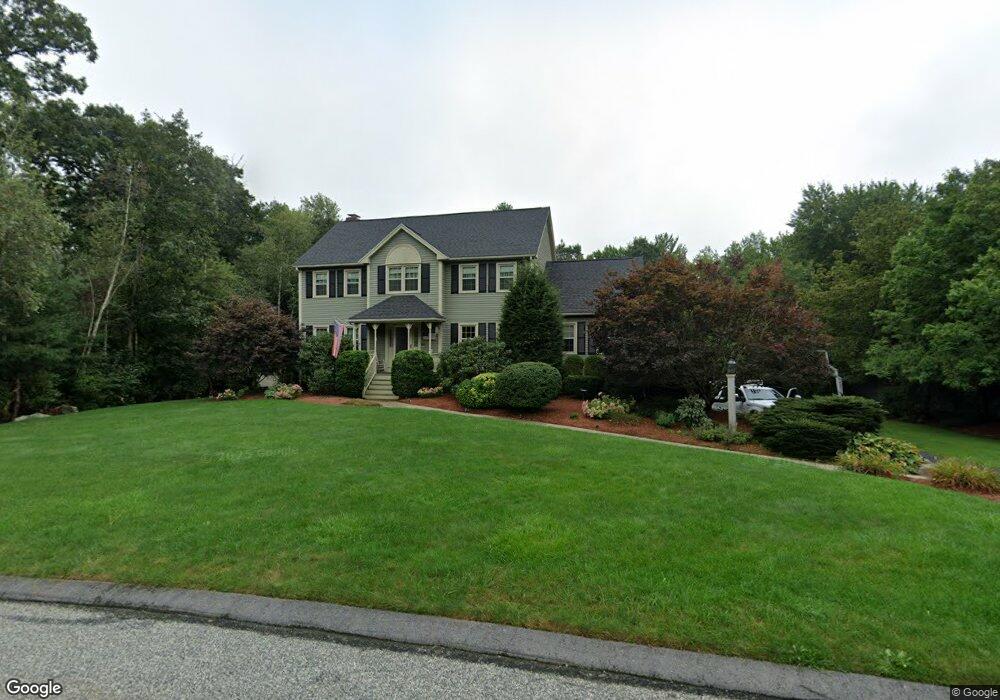
7 Gable Way Medway, MA 02053
Estimated Value: $918,557 - $1,121,000
4
Beds
4
Baths
3,068
Sq Ft
$338/Sq Ft
Est. Value
About This Home
This home is located at 7 Gable Way, Medway, MA 02053 and is currently estimated at $1,037,639, approximately $338 per square foot. 7 Gable Way is a home located in Norfolk County with nearby schools including John D. McGovern Elementary School, Burke-Memorial Elementary, and Medway Middle School.
Ownership History
Date
Name
Owned For
Owner Type
Purchase Details
Closed on
May 20, 1998
Sold by
Kings Lane Rt
Bought by
Wenzel Walter F and Wenzel Brenda L
Current Estimated Value
Home Financials for this Owner
Home Financials are based on the most recent Mortgage that was taken out on this home.
Original Mortgage
$145,000
Interest Rate
7.03%
Mortgage Type
Purchase Money Mortgage
Create a Home Valuation Report for This Property
The Home Valuation Report is an in-depth analysis detailing your home's value as well as a comparison with similar homes in the area
Home Values in the Area
Average Home Value in this Area
Purchase History
| Date | Buyer | Sale Price | Title Company |
|---|---|---|---|
| Wenzel Walter F | $337,775 | -- |
Source: Public Records
Mortgage History
| Date | Status | Borrower | Loan Amount |
|---|---|---|---|
| Open | Wenzel Walter F | $132,500 | |
| Closed | Wenzel Walter F | $145,000 |
Source: Public Records
Tax History Compared to Growth
Tax History
| Year | Tax Paid | Tax Assessment Tax Assessment Total Assessment is a certain percentage of the fair market value that is determined by local assessors to be the total taxable value of land and additions on the property. | Land | Improvement |
|---|---|---|---|---|
| 2025 | $12,380 | $868,800 | $326,000 | $542,800 |
| 2024 | $12,511 | $868,800 | $326,000 | $542,800 |
| 2023 | $12,376 | $776,400 | $296,800 | $479,600 |
| 2022 | $11,380 | $672,200 | $219,500 | $452,700 |
| 2021 | $11,188 | $640,800 | $204,800 | $436,000 |
| 2020 | $11,134 | $636,200 | $204,800 | $431,400 |
| 2019 | $10,382 | $611,800 | $196,500 | $415,300 |
| 2018 | $10,471 | $592,900 | $188,100 | $404,800 |
| 2017 | $9,964 | $556,000 | $183,900 | $372,100 |
| 2016 | $9,571 | $528,500 | $169,300 | $359,200 |
| 2015 | $9,545 | $523,300 | $167,200 | $356,100 |
| 2014 | $9,160 | $486,200 | $167,200 | $319,000 |
Source: Public Records
Map
Nearby Homes
- 280 Village St Unit D2
- 4 Shaw St
- 22 Sunset Dr
- 28 Wellington St
- 3 Meryl St
- 14 Heritage Dr
- 176 Main St Unit 3
- 20 Broad St Unit 6
- 20 Broad St Unit A
- 20 Broad St Unit 4
- 14 Sanford St Unit 15
- 12 Lovering St
- 50 Main St
- 9 Sanford St
- 106 Holliston St
- 36 Lovering St
- 21 Riverside Rd
- 0 Elm St
- 841 Lincoln St
- 7 Gloucester Dr