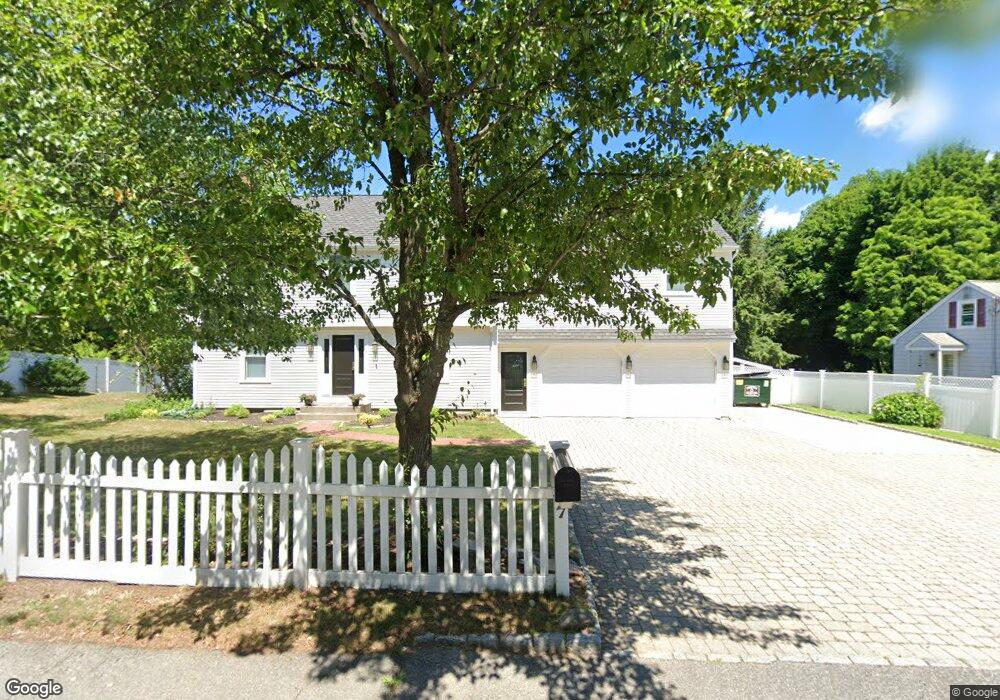
7 Glenwood St Natick, MA 01760
Estimated Value: $1,005,000 - $1,353,502
4
Beds
3
Baths
2,840
Sq Ft
$433/Sq Ft
Est. Value
About This Home
This home is located at 7 Glenwood St, Natick, MA 01760 and is currently estimated at $1,229,876, approximately $433 per square foot. 7 Glenwood St is a home located in Middlesex County with nearby schools including Natick High School, Memorial Elementary School, and J F Kennedy Middle School.
Ownership History
Date
Name
Owned For
Owner Type
Purchase Details
Closed on
Jun 30, 2020
Sold by
Bradley-Hickey Elissa
Bought by
Hickey Thomas B and Sturgeon Kim A
Current Estimated Value
Home Financials for this Owner
Home Financials are based on the most recent Mortgage that was taken out on this home.
Original Mortgage
$560,000
Outstanding Balance
$495,640
Interest Rate
3%
Mortgage Type
New Conventional
Estimated Equity
$734,236
Purchase Details
Closed on
Jun 1, 1981
Bought by
Clews Rt
Create a Home Valuation Report for This Property
The Home Valuation Report is an in-depth analysis detailing your home's value as well as a comparison with similar homes in the area
Home Values in the Area
Average Home Value in this Area
Purchase History
| Date | Buyer | Sale Price | Title Company |
|---|---|---|---|
| Hickey Thomas B | $700,000 | None Available | |
| Clews Rt | $122,000 | -- |
Source: Public Records
Mortgage History
| Date | Status | Borrower | Loan Amount |
|---|---|---|---|
| Open | Hickey Thomas B | $560,000 |
Source: Public Records
Tax History
| Year | Tax Paid | Tax Assessment Tax Assessment Total Assessment is a certain percentage of the fair market value that is determined by local assessors to be the total taxable value of land and additions on the property. | Land | Improvement |
|---|---|---|---|---|
| 2025 | $13,768 | $1,151,200 | $504,100 | $647,100 |
| 2024 | $13,322 | $1,086,600 | $477,500 | $609,100 |
| 2023 | $12,780 | $1,011,100 | $443,100 | $568,000 |
| 2022 | $11,551 | $865,900 | $398,600 | $467,300 |
| 2021 | $11,110 | $816,300 | $377,600 | $438,700 |
| 2020 | $10,857 | $797,700 | $361,900 | $435,800 |
| 2019 | $10,139 | $797,700 | $361,900 | $435,800 |
| 2018 | $9,928 | $760,800 | $346,100 | $414,700 |
| 2017 | $9,896 | $733,600 | $326,500 | $407,100 |
| 2016 | $9,901 | $729,600 | $326,500 | $403,100 |
| 2015 | $9,562 | $691,900 | $326,500 | $365,400 |
Source: Public Records
Map
Nearby Homes
Your Personal Tour Guide
Ask me questions while you tour the home.