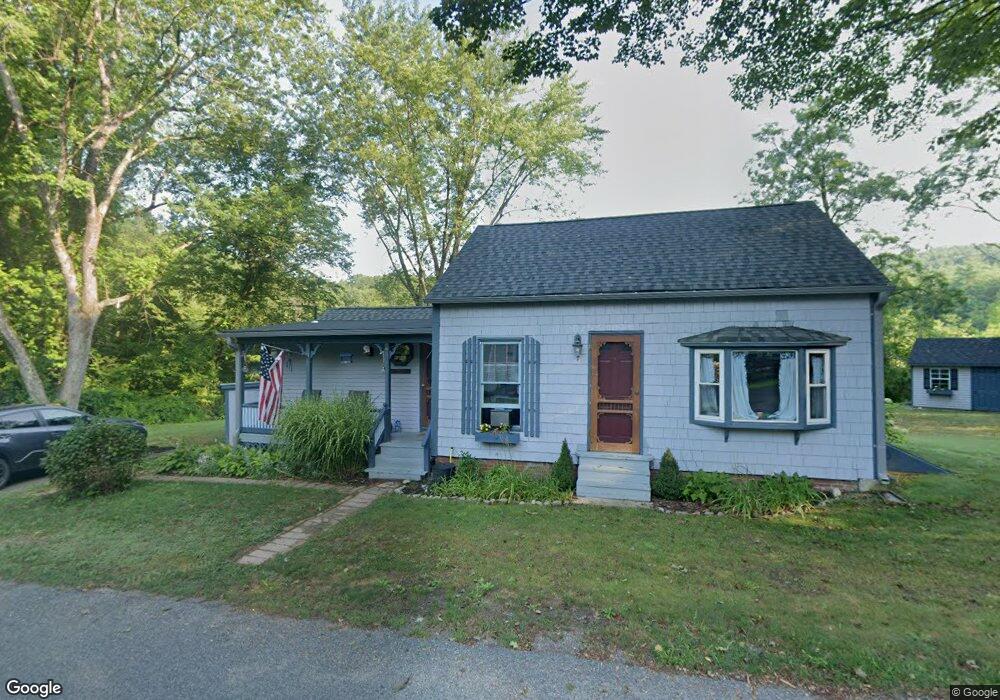
7 Hatfield St Williamsburg, MA 01039
Estimated Value: $295,000 - $361,000
3
Beds
1
Bath
1,514
Sq Ft
$213/Sq Ft
Est. Value
About This Home
This home is located at 7 Hatfield St, Williamsburg, MA 01039 and is currently estimated at $322,757, approximately $213 per square foot. 7 Hatfield St is a home located in Hampshire County with nearby schools including Anne T. Dunphy School.
Ownership History
Date
Name
Owned For
Owner Type
Purchase Details
Closed on
Jul 1, 2024
Sold by
Chapin Kenneth M
Bought by
Thurston Lori A
Current Estimated Value
Purchase Details
Closed on
Jun 2, 2010
Sold by
Sonerson Paul A
Bought by
Chapin Kenneth M
Home Financials for this Owner
Home Financials are based on the most recent Mortgage that was taken out on this home.
Original Mortgage
$164,000
Interest Rate
5.12%
Mortgage Type
Purchase Money Mortgage
Create a Home Valuation Report for This Property
The Home Valuation Report is an in-depth analysis detailing your home's value as well as a comparison with similar homes in the area
Home Values in the Area
Average Home Value in this Area
Purchase History
| Date | Buyer | Sale Price | Title Company |
|---|---|---|---|
| Thurston Lori A | $310,000 | None Available | |
| Thurston Lori A | $310,000 | None Available | |
| Thurston Lori A | $310,000 | None Available | |
| Chapin Kenneth M | $205,000 | -- | |
| Chapin Kenneth M | $205,000 | -- |
Source: Public Records
Mortgage History
| Date | Status | Borrower | Loan Amount |
|---|---|---|---|
| Previous Owner | Chapin Kenneth M | $164,000 | |
| Previous Owner | Chapin Kenneth M | $85,000 | |
| Previous Owner | Chapin Kenneth M | $43,950 |
Source: Public Records
Tax History Compared to Growth
Tax History
| Year | Tax Paid | Tax Assessment Tax Assessment Total Assessment is a certain percentage of the fair market value that is determined by local assessors to be the total taxable value of land and additions on the property. | Land | Improvement |
|---|---|---|---|---|
| 2025 | $4,392 | $231,500 | $93,700 | $137,800 |
| 2024 | $4,107 | $226,900 | $93,700 | $133,200 |
| 2023 | $4,653 | $236,900 | $93,700 | $143,200 |
| 2022 | $4,123 | $212,100 | $93,000 | $119,100 |
| 2021 | $4,181 | $199,400 | $93,000 | $106,400 |
| 2019 | $3,798 | $191,800 | $92,800 | $99,000 |
| 2018 | $3,871 | $191,800 | $92,800 | $99,000 |
| 2017 | $3,679 | $191,800 | $92,800 | $99,000 |
| 2016 | $3,596 | $191,800 | $92,800 | $99,000 |
| 2015 | $3,542 | $196,900 | $97,900 | $99,000 |
| 2014 | $3,420 | $196,900 | $97,900 | $99,000 |
Source: Public Records
Map
Nearby Homes
- 1 S Main St
- 201 Main St
- 222 River Rd
- 339 Haydenville Rd
- 0 Haydenville Rd
- 37 N Farms Rd
- 48 Evergreen Rd Unit 306
- 48 Evergreen Rd Unit 214
- 30 South St
- 15 Cole Rd
- 3 Williams St
- 481 Kennedy Rd
- 0 Old Stage Rd Unit 73394977
- 362 Kennedy Rd
- 139 Water St
- 140 Florence St
- 20 Bridge Rd Unit 8
- 96 Petticoat Hill Rd
- 213 Spring Grove Ave
- 384 Spring St