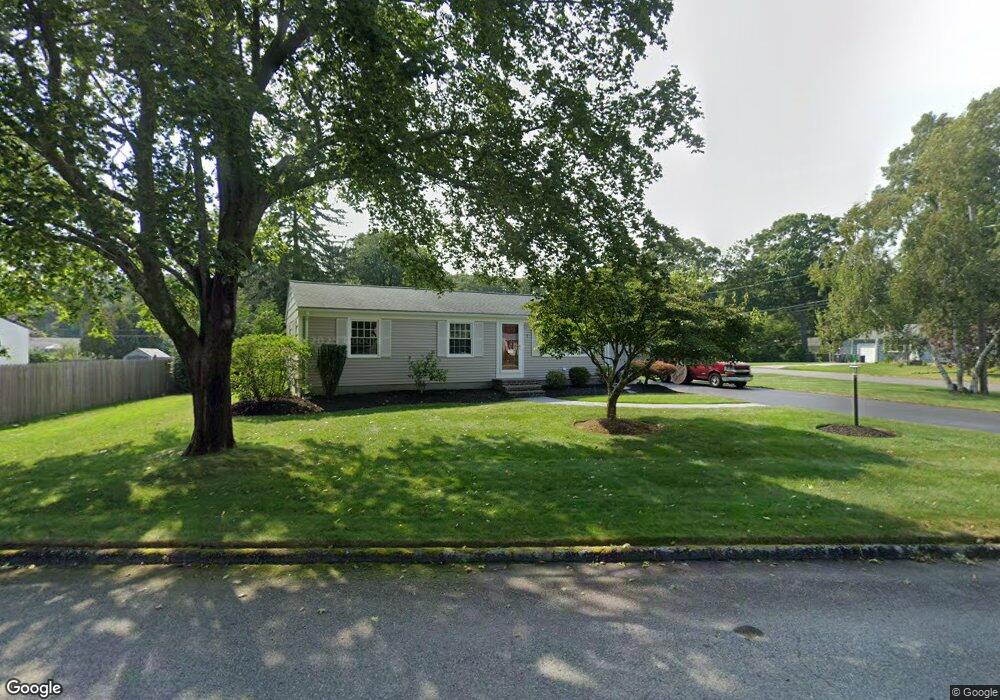
7 Hobbs Rd Warwick, RI 02889
Long Meadow NeighborhoodEstimated Value: $375,000 - $470,991
3
Beds
2
Baths
1,380
Sq Ft
$306/Sq Ft
Est. Value
About This Home
This home is located at 7 Hobbs Rd, Warwick, RI 02889 and is currently estimated at $421,748, approximately $305 per square foot. 7 Hobbs Rd is a home located in Kent County with nearby schools including Saint Kevin School and Bishop Hendricken High School.
Ownership History
Date
Name
Owned For
Owner Type
Purchase Details
Closed on
May 8, 2013
Sold by
Giarrusso Michael E and Giarrusso Lynda G
Bought by
Giarrusso Michael A and Giarrusso Lynda G
Current Estimated Value
Purchase Details
Closed on
Dec 30, 1999
Sold by
Kuncio Kevin S and Dellefave Danielle M
Bought by
Giarusso Michael A and Giarusso Lynda G
Purchase Details
Closed on
Dec 29, 1997
Sold by
Shatz Elaine S
Bought by
Kuncio Kevin S and Dellefave Danielle M
Create a Home Valuation Report for This Property
The Home Valuation Report is an in-depth analysis detailing your home's value as well as a comparison with similar homes in the area
Home Values in the Area
Average Home Value in this Area
Purchase History
| Date | Buyer | Sale Price | Title Company |
|---|---|---|---|
| Giarrusso Michael A | -- | -- | |
| Giarusso Michael A | $110,000 | -- | |
| Kuncio Kevin S | $106,000 | -- |
Source: Public Records
Mortgage History
| Date | Status | Borrower | Loan Amount |
|---|---|---|---|
| Previous Owner | Kuncio Kevin S | $77,000 | |
| Previous Owner | Kuncio Kevin S | $232,500 | |
| Previous Owner | Kuncio Kevin S | $150,000 |
Source: Public Records
Tax History Compared to Growth
Tax History
| Year | Tax Paid | Tax Assessment Tax Assessment Total Assessment is a certain percentage of the fair market value that is determined by local assessors to be the total taxable value of land and additions on the property. | Land | Improvement |
|---|---|---|---|---|
| 2025 | $4,813 | $379,000 | $112,000 | $267,000 |
| 2024 | $4,753 | $328,500 | $97,400 | $231,100 |
| 2023 | $4,661 | $328,500 | $97,400 | $231,100 |
| 2022 | $4,329 | $231,100 | $58,100 | $173,000 |
| 2021 | $4,329 | $231,100 | $58,100 | $173,000 |
| 2020 | $4,329 | $231,100 | $58,100 | $173,000 |
| 2019 | $4,329 | $231,100 | $58,100 | $173,000 |
| 2018 | $3,767 | $181,100 | $58,100 | $123,000 |
| 2017 | $3,665 | $181,100 | $58,100 | $123,000 |
| 2016 | $3,665 | $181,100 | $58,100 | $123,000 |
| 2015 | $3,440 | $165,800 | $62,200 | $103,600 |
| 2014 | $3,326 | $165,800 | $62,200 | $103,600 |
| 2013 | $3,281 | $165,800 | $62,200 | $103,600 |
Source: Public Records
Map
Nearby Homes