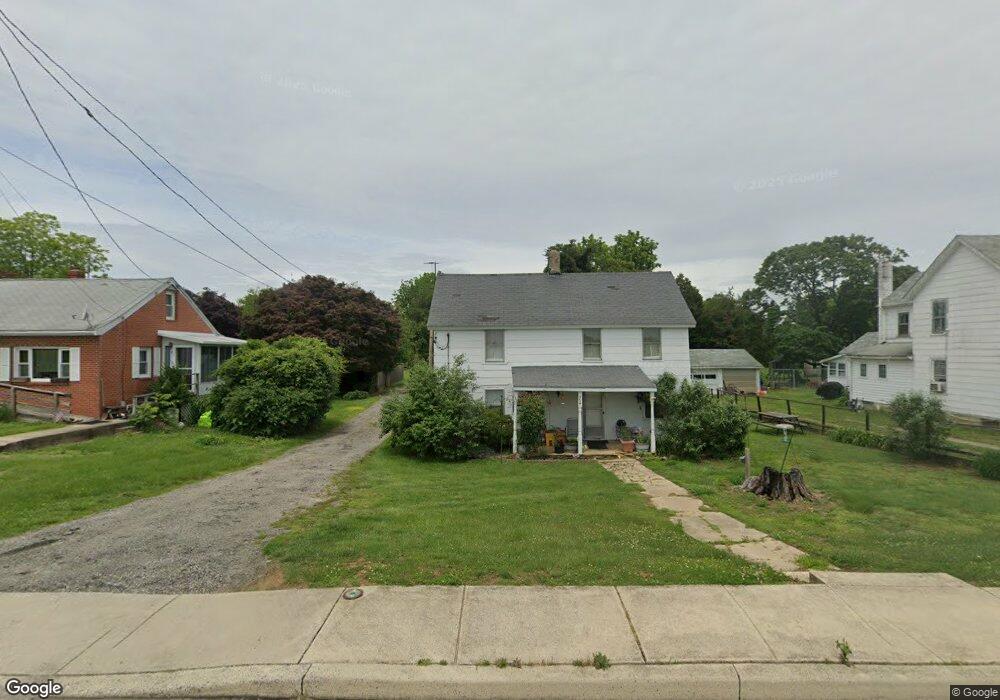
7 Howell Point Rd Betterton, MD 21610
Estimated Value: $202,856 - $222,000
--
Bed
1
Bath
960
Sq Ft
$223/Sq Ft
Est. Value
About This Home
This home is located at 7 Howell Point Rd, Betterton, MD 21610 and is currently estimated at $213,714, approximately $222 per square foot. 7 Howell Point Rd is a home located in Kent County with nearby schools including Kent County Middle School and Kent County High School.
Ownership History
Date
Name
Owned For
Owner Type
Purchase Details
Closed on
Jan 4, 2023
Sold by
Campbell Kelley R
Bought by
Campbell Kelley R and Campbell Michele N
Current Estimated Value
Purchase Details
Closed on
Jan 31, 2015
Sold by
Campbell William H
Bought by
Campbell William H and Campbell Kelley Roeder
Create a Home Valuation Report for This Property
The Home Valuation Report is an in-depth analysis detailing your home's value as well as a comparison with similar homes in the area
Home Values in the Area
Average Home Value in this Area
Purchase History
| Date | Buyer | Sale Price | Title Company |
|---|---|---|---|
| Campbell Kelley R | -- | -- | |
| Campbell William H | -- | None Available |
Source: Public Records
Tax History Compared to Growth
Tax History
| Year | Tax Paid | Tax Assessment Tax Assessment Total Assessment is a certain percentage of the fair market value that is determined by local assessors to be the total taxable value of land and additions on the property. | Land | Improvement |
|---|---|---|---|---|
| 2025 | $2,541 | $175,000 | $104,200 | $70,800 |
| 2024 | $2,451 | $168,800 | $0 | $0 |
| 2023 | $2,361 | $162,600 | $0 | $0 |
| 2022 | $2,255 | $156,400 | $104,200 | $52,200 |
| 2021 | $2,271 | $156,400 | $104,200 | $52,200 |
| 2020 | $2,271 | $156,400 | $104,200 | $52,200 |
| 2019 | $2,460 | $169,400 | $119,200 | $50,200 |
| 2018 | $2,460 | $169,400 | $119,200 | $50,200 |
| 2017 | $2,463 | $169,400 | $0 | $0 |
| 2016 | -- | $169,400 | $0 | $0 |
| 2015 | $2,488 | $169,400 | $0 | $0 |
| 2014 | $2,488 | $169,400 | $0 | $0 |
Source: Public Records
Map
Nearby Homes
- 3 Howell Point Rd
- 200 Ericsson Ave
- 14 3rd Ave
- 21 6th Ave
- 1 Kent Dr
- 0 1st Ave
- 1 Bayview Rd Unit 11A
- 1 Bayview Rd
- 13699 Still Pond Rd
- 13931 Eagles Nest Farm Ln
- 0 Dutchtown Rd
- 0 Blackmon Ln
- 25619 W Hill Rd
- 0 Main St
- 26670 Maple Ave
- 12765 Still Pond Rd
- 12776 Still Pond Rd
- 0 Medders Rd
- 75 Vermont Ave
- 24 Ches Haven Rd
- 322 Ericsson Ave
- 324 Ericsson Ave
- 9 Howell Point Rd
- 5 Howell Point Rd
- 11 Howell Point Rd
- 318 Ericsson Ave
- 331 Ericsson Ave
- 329 Ericsson Ave
- 505 Main St
- 501 Main St
- 321 Ericsson Ave
- 503 Main St
- 314 Ericsson Ave
- 407 Main St
- 2 Howell Point Rd
- 405 Main St
- 312 Ericsson Ave
- 403 Main St
- 315 Ericsson Ave
- 401 Main St