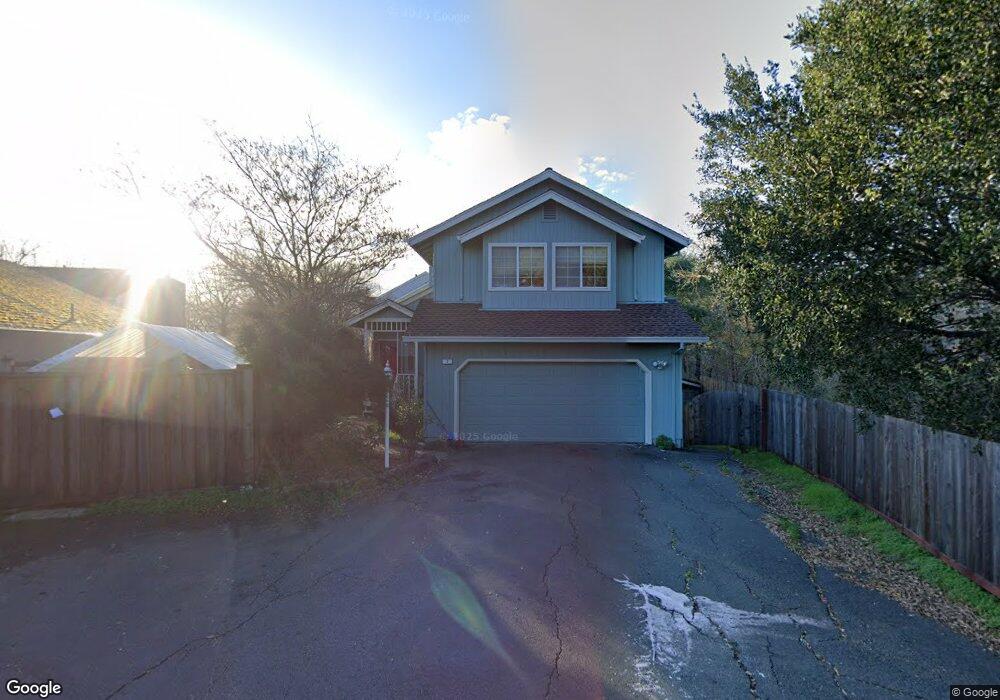
7 Hull St Santa Rosa, CA 95401
Estimated Value: $641,000 - $702,000
3
Beds
3
Baths
1,368
Sq Ft
$491/Sq Ft
Est. Value
About This Home
This home is located at 7 Hull St, Santa Rosa, CA 95401 and is currently estimated at $671,641, approximately $490 per square foot. 7 Hull St is a home located in Sonoma County with nearby schools including Elsie Allen High School, Kid Street Charter School, and St. Michael's Orthodox School.
Ownership History
Date
Name
Owned For
Owner Type
Purchase Details
Closed on
Jun 27, 2024
Sold by
Drew Kathleen
Bought by
Drew-Heller Family Living Trust and Drew
Current Estimated Value
Purchase Details
Closed on
Aug 19, 2015
Sold by
Lundberg Roger and Lundberg Renate K
Bought by
Heller Stanley and Drew Kathleen
Home Financials for this Owner
Home Financials are based on the most recent Mortgage that was taken out on this home.
Original Mortgage
$389,600
Interest Rate
3.97%
Mortgage Type
New Conventional
Purchase Details
Closed on
May 14, 2007
Sold by
Gray Carol
Bought by
Lundberg Roger and Lundberg Renate K
Home Financials for this Owner
Home Financials are based on the most recent Mortgage that was taken out on this home.
Original Mortgage
$325,000
Interest Rate
6.17%
Mortgage Type
Purchase Money Mortgage
Purchase Details
Closed on
Jul 5, 2006
Sold by
Gray Carol
Bought by
Gray Carol
Home Financials for this Owner
Home Financials are based on the most recent Mortgage that was taken out on this home.
Original Mortgage
$120,000
Interest Rate
6.66%
Mortgage Type
New Conventional
Purchase Details
Closed on
Nov 8, 2000
Sold by
Miller Ronald and Miller Julie
Bought by
Gray Dennis D and Gray Carol
Home Financials for this Owner
Home Financials are based on the most recent Mortgage that was taken out on this home.
Original Mortgage
$119,500
Interest Rate
7.82%
Purchase Details
Closed on
Nov 8, 1995
Sold by
Engle Julie A and Miller Ronald E
Bought by
Miller Ronald and Miller Julie
Home Financials for this Owner
Home Financials are based on the most recent Mortgage that was taken out on this home.
Original Mortgage
$25,000
Interest Rate
7.58%
Purchase Details
Closed on
Oct 20, 1993
Sold by
Engel Julie A and Miller Ronald E
Bought by
Engel Julie A and Miller Ronald E
Home Financials for this Owner
Home Financials are based on the most recent Mortgage that was taken out on this home.
Original Mortgage
$166,250
Interest Rate
7.2%
Create a Home Valuation Report for This Property
The Home Valuation Report is an in-depth analysis detailing your home's value as well as a comparison with similar homes in the area
Home Values in the Area
Average Home Value in this Area
Purchase History
| Date | Buyer | Sale Price | Title Company |
|---|---|---|---|
| Drew-Heller Family Living Trust | -- | None Listed On Document | |
| Drew-Heller Family Living Trust | -- | None Listed On Document | |
| Heller Stanley | $487,000 | First American Title Company | |
| Lundberg Roger | $485,000 | Cornerstone Title Company | |
| Gray Carol | -- | New Century Title Company | |
| Gray Dennis D | $284,500 | New Century Title Co | |
| Miller Ronald | -- | Fidelity National Title | |
| Engel Julie A | -- | North Bay Title Co |
Source: Public Records
Mortgage History
| Date | Status | Borrower | Loan Amount |
|---|---|---|---|
| Previous Owner | Heller Stanley | $389,600 | |
| Previous Owner | Lundberg Roger | $325,000 | |
| Previous Owner | Gray Carol | $120,000 | |
| Previous Owner | Gray Dennis D | $119,500 | |
| Previous Owner | Miller Ronald | $25,000 | |
| Previous Owner | Engel Julie A | $166,250 |
Source: Public Records
Tax History Compared to Growth
Tax History
| Year | Tax Paid | Tax Assessment Tax Assessment Total Assessment is a certain percentage of the fair market value that is determined by local assessors to be the total taxable value of land and additions on the property. | Land | Improvement |
|---|---|---|---|---|
| 2025 | $6,491 | $576,500 | $230,837 | $345,663 |
| 2024 | $6,491 | $565,197 | $226,311 | $338,886 |
| 2023 | $6,491 | $554,116 | $221,874 | $332,242 |
| 2022 | $6,125 | $543,252 | $217,524 | $325,728 |
| 2021 | $6,047 | $532,601 | $213,259 | $319,342 |
| 2020 | $5,888 | $527,141 | $211,073 | $316,068 |
| 2019 | $5,817 | $516,806 | $206,935 | $309,871 |
| 2018 | $5,766 | $506,674 | $202,878 | $303,796 |
| 2017 | $5,644 | $496,740 | $198,900 | $297,840 |
| 2016 | $5,604 | $487,000 | $195,000 | $292,000 |
| 2015 | $4,377 | $393,000 | $158,000 | $235,000 |
| 2014 | $3,316 | $306,000 | $123,000 | $183,000 |
Source: Public Records
Map
Nearby Homes