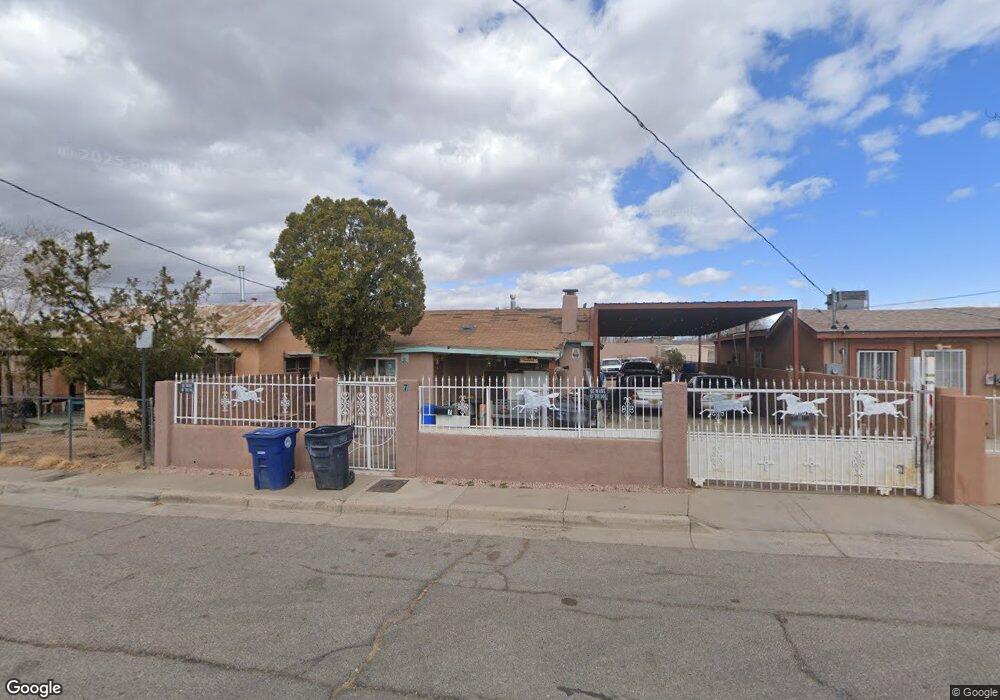
7 La Poblana Rd NW Albuquerque, NM 87107
Near North Valley NeighborhoodEstimated Value: $188,000 - $216,066
2
Beds
1
Bath
950
Sq Ft
$216/Sq Ft
Est. Value
About This Home
This home is located at 7 La Poblana Rd NW, Albuquerque, NM 87107 and is currently estimated at $205,267, approximately $216 per square foot. 7 La Poblana Rd NW is a home located in Bernalillo County with nearby schools including Garfield Middle, Valley High School, and Native American Community Academy.
Ownership History
Date
Name
Owned For
Owner Type
Purchase Details
Closed on
Jan 25, 2001
Sold by
Luna Salvador Perez
Bought by
Luna Salvador Perez and Gutierrez Beatris Rodriguez
Current Estimated Value
Home Financials for this Owner
Home Financials are based on the most recent Mortgage that was taken out on this home.
Original Mortgage
$61,595
Outstanding Balance
$22,437
Interest Rate
7.72%
Estimated Equity
$182,830
Purchase Details
Closed on
Dec 8, 2000
Sold by
Gandarilla Carlos A
Bought by
Luna Salvador Perez
Home Financials for this Owner
Home Financials are based on the most recent Mortgage that was taken out on this home.
Original Mortgage
$61,595
Outstanding Balance
$22,437
Interest Rate
7.72%
Estimated Equity
$182,830
Purchase Details
Closed on
May 29, 1998
Sold by
Carriaga Ernest G
Bought by
Gandarilla Carlos A
Home Financials for this Owner
Home Financials are based on the most recent Mortgage that was taken out on this home.
Original Mortgage
$43,200
Interest Rate
7.2%
Create a Home Valuation Report for This Property
The Home Valuation Report is an in-depth analysis detailing your home's value as well as a comparison with similar homes in the area
Home Values in the Area
Average Home Value in this Area
Purchase History
| Date | Buyer | Sale Price | Title Company |
|---|---|---|---|
| Luna Salvador Perez | -- | First American Title Ins Co | |
| Luna Salvador Perez | -- | First American Title Ins Co | |
| Gandarilla Carlos A | -- | First American Title Ins Co |
Source: Public Records
Mortgage History
| Date | Status | Borrower | Loan Amount |
|---|---|---|---|
| Open | Luna Salvador Perez | $61,595 | |
| Previous Owner | Gandarilla Carlos A | $43,200 |
Source: Public Records
Tax History Compared to Growth
Tax History
| Year | Tax Paid | Tax Assessment Tax Assessment Total Assessment is a certain percentage of the fair market value that is determined by local assessors to be the total taxable value of land and additions on the property. | Land | Improvement |
|---|---|---|---|---|
| 2025 | $1,373 | $31,365 | $9,110 | $22,255 |
| 2024 | $1,373 | $30,452 | $8,845 | $21,607 |
| 2023 | $1,345 | $29,565 | $8,587 | $20,978 |
| 2022 | $1,271 | $28,704 | $8,337 | $20,367 |
| 2021 | $1,226 | $27,869 | $8,095 | $19,774 |
| 2020 | $1,202 | $27,057 | $7,859 | $19,198 |
| 2019 | $1,164 | $26,270 | $7,631 | $18,639 |
| 2018 | $1,120 | $26,270 | $7,631 | $18,639 |
| 2017 | $1,078 | $25,506 | $7,409 | $18,097 |
| 2016 | $1,039 | $24,042 | $6,984 | $17,058 |
| 2015 | $23,341 | $23,341 | $6,780 | $16,561 |
| 2014 | $964 | $22,662 | $6,583 | $16,079 |
| 2013 | -- | $22,002 | $6,391 | $15,611 |
Source: Public Records
Map
Nearby Homes
- 2405 Commercial St NE
- 2403 Broadway Blvd NE
- 308 Prospect Ave NE
- 435 Cordova Ave NW
- 2210 Commercial St NE
- 601 Menaul Blvd NE Unit 4002
- 601 Menaul Blvd NE Unit 2304
- 601 Menaul Blvd NE Unit 305
- 601 Menaul Blvd NE Unit 505
- 601 Menaul Blvd NE Unit 2106
- 232 Candelaria Rd NW
- 615 Los Arboles Ave NW
- 3103 Los Tomases Dr NW
- 3733 Arno St NE
- 425 Fitzgerald Rd NW
- 2913 8th St NW
- 2201 7th St NW
- 2908 10th St NW
- 150 Mescalero Rd NW
- 3720 Candelarias Ln NW
- 3 La Poblana Rd NW
- 11 La Poblana Rd NW
- 2804 1st St NW
- 2712 1st St NW
- 2810 1st St NW
- 14 La Poblana Rd NW
- 2710 1st St NW
- 4 Phoenix Ave NW
- 2812 1st St NW
- 18 Phoenix Ave NW
- 2708 1st St NW
- 101 Woodland Ave NW
- 2706 1st St NW
- 0 Phoenix Ave NW Unit 123096
- 0 Phoenix Ave NW
- 2704 1st St NW
- 2721 1st St NW
- 2819 1st St NW
- 15 Phoenix Ave NW
- 3 Woodland Ave NW