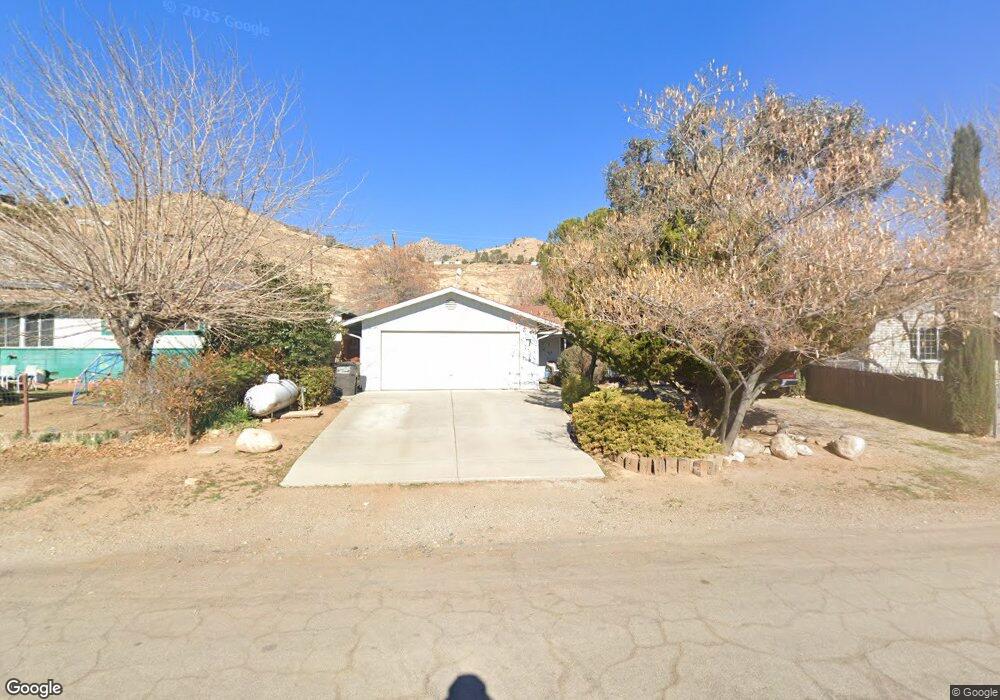
7 Laurel St Wofford Heights, CA 93285
Estimated Value: $199,844 - $213,000
2
Beds
2
Baths
988
Sq Ft
$208/Sq Ft
Est. Value
About This Home
This home is located at 7 Laurel St, Wofford Heights, CA 93285 and is currently estimated at $205,961, approximately $208 per square foot. 7 Laurel St is a home located in Kern County with nearby schools including Kern Valley High School.
Ownership History
Date
Name
Owned For
Owner Type
Purchase Details
Closed on
Jul 13, 2011
Sold by
Klein Thomas D and Klein Linda Sue
Bought by
Scharf Robert A and Heil Peter E
Current Estimated Value
Home Financials for this Owner
Home Financials are based on the most recent Mortgage that was taken out on this home.
Original Mortgage
$105,262
Outstanding Balance
$72,143
Interest Rate
4.43%
Mortgage Type
FHA
Estimated Equity
$133,818
Purchase Details
Closed on
Jul 1, 2010
Sold by
Klein Linda Sue
Bought by
Klein Thomas D and Klein Linda Sue
Purchase Details
Closed on
Aug 2, 1999
Sold by
Haggins Dorothy E Tr
Bought by
Debolt Geraldine M
Home Financials for this Owner
Home Financials are based on the most recent Mortgage that was taken out on this home.
Original Mortgage
$48,000
Interest Rate
7.56%
Purchase Details
Closed on
Jul 12, 1995
Sold by
Johnson Nola
Bought by
Johnson Ralph V
Purchase Details
Closed on
Apr 12, 1995
Sold by
Rogers C Jeanette
Bought by
Rush F D
Create a Home Valuation Report for This Property
The Home Valuation Report is an in-depth analysis detailing your home's value as well as a comparison with similar homes in the area
Home Values in the Area
Average Home Value in this Area
Purchase History
| Date | Buyer | Sale Price | Title Company |
|---|---|---|---|
| Scharf Robert A | $108,000 | Chicago Title Company | |
| Klein Thomas D | -- | None Available | |
| Debolt Geraldine M | $68,000 | Fidelity National Title Co | |
| Johnson Ralph V | -- | Fidelity National Title | |
| Haggins Dorothy | $75,000 | Fidelity National Title | |
| Rush F D | $17,000 | Fidelity National Title |
Source: Public Records
Mortgage History
| Date | Status | Borrower | Loan Amount |
|---|---|---|---|
| Open | Scharf Robert A | $105,262 | |
| Previous Owner | Debolt Geraldine M | $48,000 |
Source: Public Records
Tax History Compared to Growth
Tax History
| Year | Tax Paid | Tax Assessment Tax Assessment Total Assessment is a certain percentage of the fair market value that is determined by local assessors to be the total taxable value of land and additions on the property. | Land | Improvement |
|---|---|---|---|---|
| 2025 | $1,612 | $135,644 | $18,837 | $116,807 |
| 2024 | $1,569 | $132,985 | $18,468 | $114,517 |
| 2023 | $1,569 | $130,378 | $18,106 | $112,272 |
| 2022 | $1,523 | $127,822 | $17,751 | $110,071 |
| 2021 | $1,460 | $125,316 | $17,403 | $107,913 |
| 2020 | $1,420 | $124,032 | $17,225 | $106,807 |
| 2019 | $1,396 | $124,032 | $17,225 | $106,807 |
| 2018 | $1,364 | $119,217 | $16,557 | $102,660 |
| 2017 | $1,349 | $116,881 | $16,233 | $100,648 |
| 2016 | $1,265 | $114,590 | $15,915 | $98,675 |
| 2015 | $1,253 | $112,869 | $15,676 | $97,193 |
| 2014 | $1,230 | $110,659 | $15,369 | $95,290 |
Source: Public Records
Map
Nearby Homes
- 0 Sycamore Dr
- 0 Panorama Dr Unit 2607128
- 0 Panorama Dr Unit SB22017995
- 539 Sierra Vista Dr
- 102 Park
- 256 Rockhaven Rd
- 35 E Evans Rd Unit 56
- 0 Williams St
- 44 Lago Vista Dr
- 305 Bristlecone Dr
- 5 Shadowglen Way
- 131 Donalda Ct
- 801 Sierra Vista Dr
- 830 Sierra Vista Dr
- 411 Woodland Dr
- 345 Woodland Dr
- 127 Donalda Ct
- 810 Sycamore Dr
- 757 Bristlecone Dr
- 99 Evans Rd Unit 3
- 1 Laurel St
- 13 Laurel St
- 19 Laurel St
- 20 Laurel St
- 14 Laurel St Wofford Heights
- 8 Pine St Wofford Heights
- 26 Laurel St
- 25 Laurel St
- 2 Laurel St
- 14 Pine St
- 31 Laurel St
- 217 Panorama Dr
- 26 Pine St
- 219 Panorama Dr
- 201 Panorama Dr
- 38 Laurel St Wofford Heights
- 37 Laurel St
- 7 Pine St
- 231 Panorama Dr
- 38 Sycamore Dr Wofford Heights