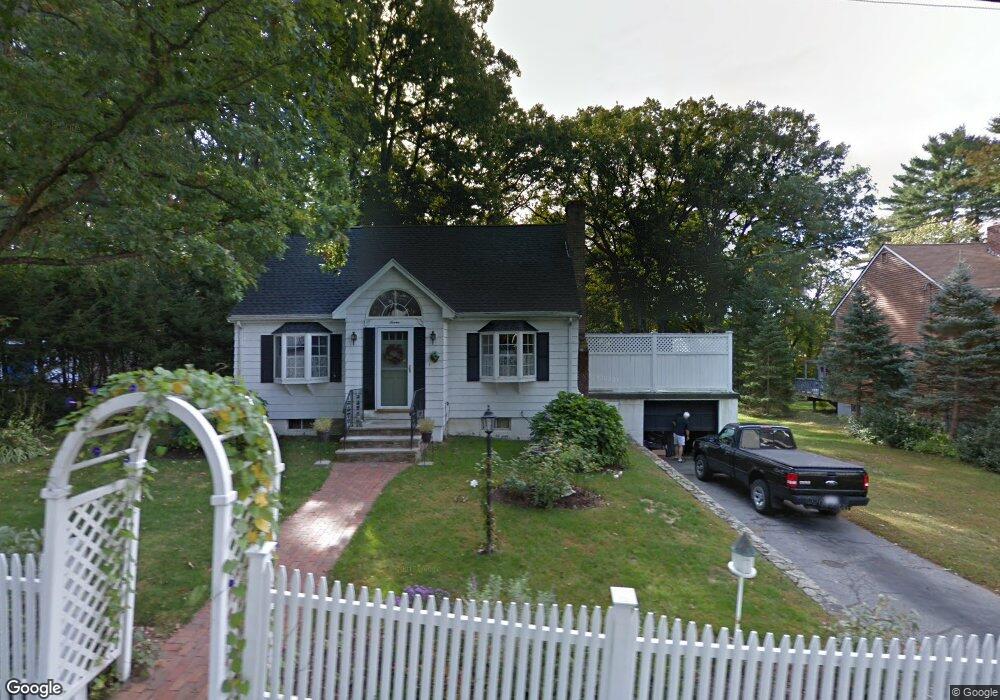
7 Longview Rd Wilmington, MA 01887
North Wilmington NeighborhoodEstimated Value: $696,000 - $812,000
2
Beds
2
Baths
1,582
Sq Ft
$471/Sq Ft
Est. Value
About This Home
This home is located at 7 Longview Rd, Wilmington, MA 01887 and is currently estimated at $744,985, approximately $470 per square foot. 7 Longview Rd is a home located in Middlesex County with nearby schools including Wilmington Middle School, Wilmington High School, and Abundant Life Christian School and Childcare.
Ownership History
Date
Name
Owned For
Owner Type
Purchase Details
Closed on
Apr 5, 2004
Sold by
Emond Maureen O and Carreiro Maureen
Bought by
Carreiro Francis M
Current Estimated Value
Purchase Details
Closed on
Aug 18, 1978
Bought by
Carreiro Francis M
Create a Home Valuation Report for This Property
The Home Valuation Report is an in-depth analysis detailing your home's value as well as a comparison with similar homes in the area
Home Values in the Area
Average Home Value in this Area
Purchase History
| Date | Buyer | Sale Price | Title Company |
|---|---|---|---|
| Carreiro Francis M | -- | -- | |
| Carreiro Francis M | $45,500 | -- |
Source: Public Records
Mortgage History
| Date | Status | Borrower | Loan Amount |
|---|---|---|---|
| Open | Carreiro Francis M | $50,000 | |
| Previous Owner | Carreiro Francis M | $20,000 |
Source: Public Records
Tax History Compared to Growth
Tax History
| Year | Tax Paid | Tax Assessment Tax Assessment Total Assessment is a certain percentage of the fair market value that is determined by local assessors to be the total taxable value of land and additions on the property. | Land | Improvement |
|---|---|---|---|---|
| 2025 | $6,884 | $601,200 | $305,800 | $295,400 |
| 2024 | $6,620 | $579,200 | $305,800 | $273,400 |
| 2023 | $6,538 | $547,600 | $278,100 | $269,500 |
| 2022 | $6,309 | $484,200 | $231,700 | $252,500 |
| 2021 | $6,150 | $444,400 | $210,600 | $233,800 |
| 2020 | $5,970 | $439,600 | $210,600 | $229,000 |
| 2019 | $5,903 | $429,300 | $200,400 | $228,900 |
| 2018 | $5,604 | $388,900 | $191,000 | $197,900 |
| 2017 | $5,406 | $374,100 | $191,000 | $183,100 |
| 2016 | $5,068 | $346,400 | $182,000 | $164,400 |
| 2015 | $4,733 | $329,400 | $182,000 | $147,400 |
| 2014 | $4,602 | $323,200 | $173,400 | $149,800 |
Source: Public Records
Map
Nearby Homes
- 3 Oakdale Rd
- 12 Lockwood Rd
- 5 Flynn Way
- 3 Adelman Rd
- 8 McDonald Rd
- 62 Faulkner Ave
- 40 Faulkner Ave
- 1 Summer St
- 96 Middlesex Ave
- 40 Agostino Dr
- 5 Oak St
- 27 Fairview Ave
- 220 Martins Landing Unit 309
- 260 Martins Landing Unit 508
- 260 Martins Landing Unit 103
- 17 Lake St
- 300 Martins Landing Unit 107
- 320 Martins Landing Unit 108
- 320 Martins Landing Unit 109
- 320 Martins Landing Unit 110