Estimated Value: $424,000 - $455,000
3
Beds
1
Bath
1,080
Sq Ft
$408/Sq Ft
Est. Value
About This Home
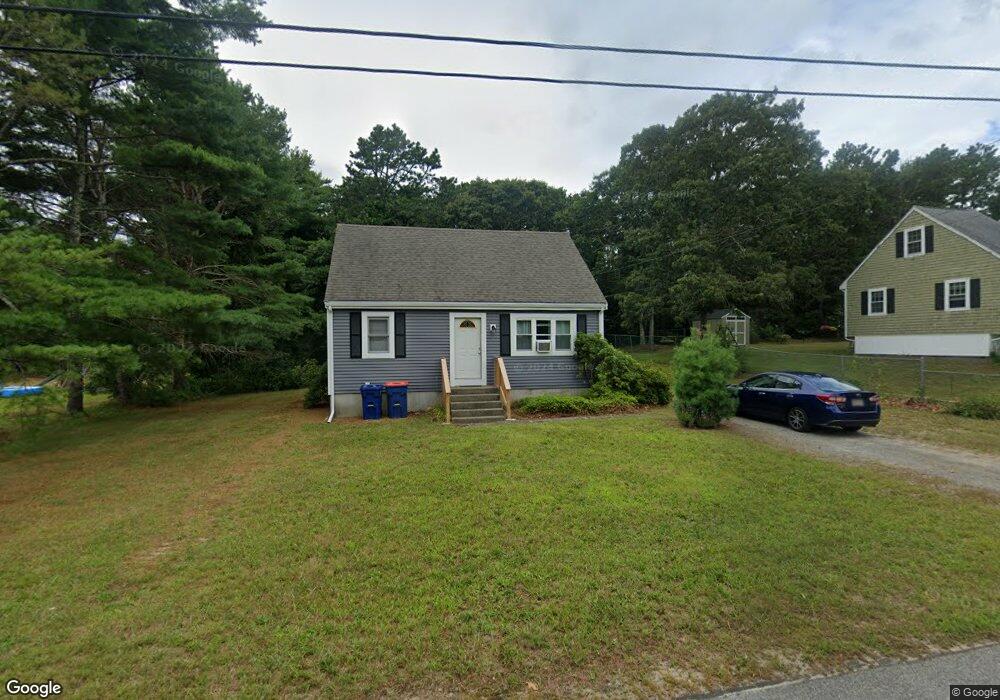
This home is located at 7 Lori Ln, East Wareham, MA 02538 and is currently estimated at $440,564, approximately $407 per square foot. 7 Lori Ln is a home located in Plymouth County with nearby schools including South Elementary School, Plymouth South Middle School, and Plymouth South High School.
Ownership History
Date
Name
Owned For
Owner Type
Purchase Details
Closed on
Jul 20, 2009
Sold by
Kelly Willliam J
Bought by
Frost Lynn A and Frost Timothy J
Current Estimated Value
Purchase Details
Closed on
Feb 12, 1996
Sold by
Sprague Peter K
Bought by
Rockland Trust Co
Create a Home Valuation Report for This Property
The Home Valuation Report is an in-depth analysis detailing your home's value as well as a comparison with similar homes in the area
Home Values in the Area
Average Home Value in this Area
Purchase History
| Date | Buyer | Sale Price | Title Company |
|---|---|---|---|
| Frost Lynn A | $175,100 | -- | |
| Frost Lynn A | $175,100 | -- | |
| Rockland Trust Co | $72,427 | -- | |
| Rockland Trust Co | $72,427 | -- |
Source: Public Records
Mortgage History
| Date | Status | Borrower | Loan Amount |
|---|---|---|---|
| Previous Owner | Rockland Trust Co | $26,700 | |
| Previous Owner | Rockland Trust Co | $61,500 | |
| Previous Owner | Rockland Trust Co | $15,000 |
Source: Public Records
Tax History Compared to Growth
Tax History
| Year | Tax Paid | Tax Assessment Tax Assessment Total Assessment is a certain percentage of the fair market value that is determined by local assessors to be the total taxable value of land and additions on the property. | Land | Improvement |
|---|---|---|---|---|
| 2025 | $3,510 | $336,900 | $111,800 | $225,100 |
| 2024 | $3,516 | $313,100 | $87,900 | $225,200 |
| 2023 | $3,096 | $277,400 | $79,800 | $197,600 |
| 2022 | $3,096 | $234,900 | $79,800 | $155,100 |
| 2021 | $3,059 | $227,400 | $79,800 | $147,600 |
| 2020 | $2,916 | $219,900 | $79,800 | $140,100 |
| 2019 | $2,880 | $216,700 | $79,100 | $137,600 |
| 2018 | $2,677 | $196,400 | $79,100 | $117,300 |
| 2017 | $2,573 | $191,300 | $79,100 | $112,200 |
| 2016 | $2,481 | $183,400 | $78,900 | $104,500 |
| 2015 | $2,397 | $183,400 | $78,900 | $104,500 |
| 2014 | $2,258 | $175,700 | $75,000 | $100,700 |
Source: Public Records
Map
Nearby Homes