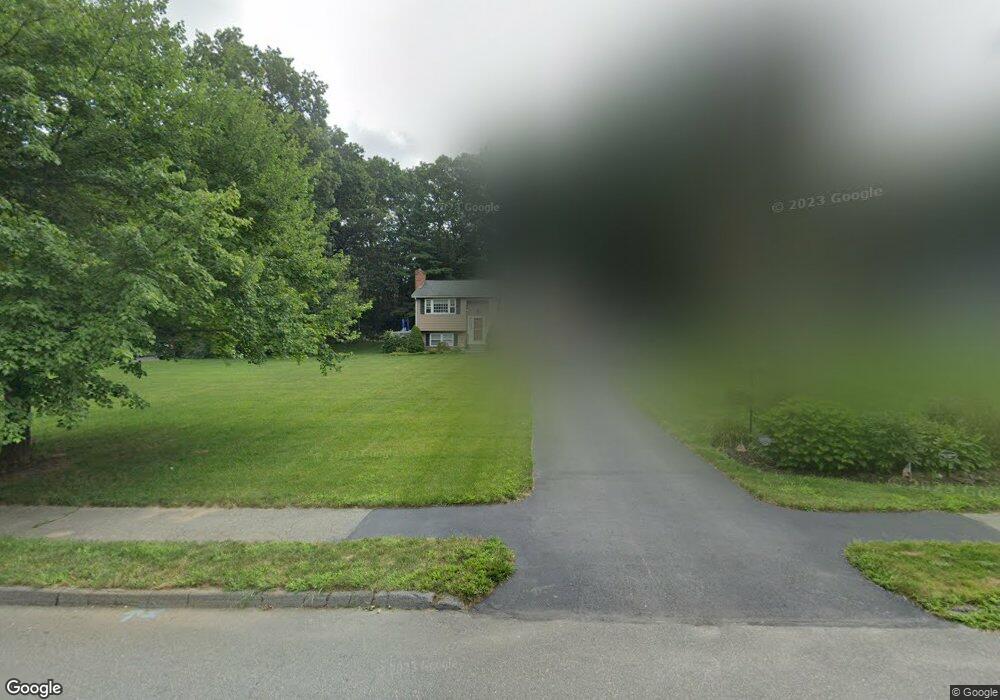
7 Lucaya Cir Wilmington, MA 01887
Estimated Value: $613,000 - $824,000
3
Beds
2
Baths
1,080
Sq Ft
$678/Sq Ft
Est. Value
About This Home
This home is located at 7 Lucaya Cir, Wilmington, MA 01887 and is currently estimated at $732,223, approximately $677 per square foot. 7 Lucaya Cir is a home located in Middlesex County with nearby schools including Wilmington Middle School, Wilmington High School, and N Reading Knowledge Beginnings.
Ownership History
Date
Name
Owned For
Owner Type
Purchase Details
Closed on
Sep 18, 2019
Sold by
Rappoli Richard R and Rappoli Elaine M
Bought by
Rappoli Ft
Current Estimated Value
Purchase Details
Closed on
Sep 8, 1976
Bought by
Rappoli Richard R and Rappoli Elaine M
Create a Home Valuation Report for This Property
The Home Valuation Report is an in-depth analysis detailing your home's value as well as a comparison with similar homes in the area
Home Values in the Area
Average Home Value in this Area
Purchase History
| Date | Buyer | Sale Price | Title Company |
|---|---|---|---|
| Rappoli Ft | -- | -- | |
| Rappoli Richard R | $44,500 | -- |
Source: Public Records
Mortgage History
| Date | Status | Borrower | Loan Amount |
|---|---|---|---|
| Previous Owner | Rappoli Richard R | $225,000 | |
| Previous Owner | Rappoli Richard R | $35,000 |
Source: Public Records
Tax History Compared to Growth
Tax History
| Year | Tax Paid | Tax Assessment Tax Assessment Total Assessment is a certain percentage of the fair market value that is determined by local assessors to be the total taxable value of land and additions on the property. | Land | Improvement |
|---|---|---|---|---|
| 2025 | $7,172 | $626,400 | $339,100 | $287,300 |
| 2024 | $7,116 | $622,600 | $339,100 | $283,500 |
| 2023 | $6,620 | $554,400 | $287,800 | $266,600 |
| 2022 | $6,275 | $481,600 | $239,700 | $241,900 |
| 2021 | $6,137 | $443,400 | $217,900 | $225,500 |
| 2020 | $6,164 | $453,900 | $217,900 | $236,000 |
| 2019 | $5,776 | $420,100 | $213,000 | $207,100 |
| 2018 | $5,459 | $378,800 | $202,900 | $175,900 |
| 2017 | $5,381 | $372,400 | $202,900 | $169,500 |
| 2016 | $5,121 | $350,000 | $193,400 | $156,600 |
| 2015 | $4,950 | $344,500 | $193,400 | $151,100 |
| 2014 | $4,662 | $327,400 | $184,200 | $143,200 |
Source: Public Records
Map
Nearby Homes
- 3 Gordon Rd
- 220 Martins Landing Unit 309
- 260 Martins Landing Unit 508
- 260 Martins Landing Unit 103
- 200 Martins Landing Unit 102
- 320 Martins Landing Unit 311
- 320 Martins Landing Unit 108
- 320 Martins Landing Unit 109
- 320 Martins Landing Unit 110
- 320 Martins Landing Unit 303
- 320 Martins Landing Unit 102
- 320 Martins Landing Unit 103
- 320 Martins Landing Unit 2410
- 320 Martins Landing Unit 403
- 320 Martins Landing Unit 107
- 320 Martins Landing Unit 210
- 320 Martins Landing Unit 2201
- 320 Martins Landing Unit 112
- 320 Martins Landing Unit 206
- 320 Martins Landing Unit 2307