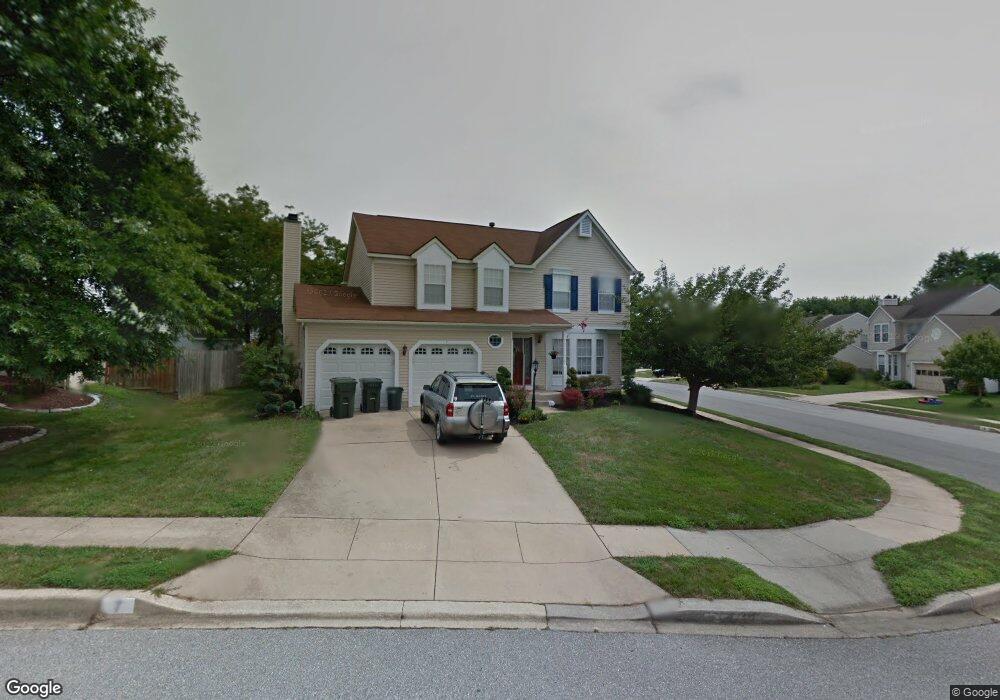
7 Mackenzie Dr Newark, DE 19711
Estimated Value: $357,000 - $494,000
4
Beds
3
Baths
1,680
Sq Ft
$267/Sq Ft
Est. Value
About This Home
This home is located at 7 Mackenzie Dr, Newark, DE 19711 and is currently estimated at $447,956, approximately $266 per square foot. 7 Mackenzie Dr is a home located in New Castle County with nearby schools including Downes (John R.) Elementary School, Shue-Medill Middle School, and Newark High School.
Ownership History
Date
Name
Owned For
Owner Type
Purchase Details
Closed on
Jul 11, 2003
Sold by
Fawzi Mark J and Fawzi Jennifer B
Bought by
Mundell Howard and Mundell Melanie
Current Estimated Value
Home Financials for this Owner
Home Financials are based on the most recent Mortgage that was taken out on this home.
Original Mortgage
$160,000
Interest Rate
5.82%
Mortgage Type
Purchase Money Mortgage
Create a Home Valuation Report for This Property
The Home Valuation Report is an in-depth analysis detailing your home's value as well as a comparison with similar homes in the area
Home Values in the Area
Average Home Value in this Area
Purchase History
| Date | Buyer | Sale Price | Title Company |
|---|---|---|---|
| Mundell Howard | $239,900 | -- |
Source: Public Records
Mortgage History
| Date | Status | Borrower | Loan Amount |
|---|---|---|---|
| Previous Owner | Mundell Howard | $160,000 |
Source: Public Records
Tax History
| Year | Tax Paid | Tax Assessment Tax Assessment Total Assessment is a certain percentage of the fair market value that is determined by local assessors to be the total taxable value of land and additions on the property. | Land | Improvement |
|---|---|---|---|---|
| 2024 | $938 | $88,900 | $12,800 | $76,100 |
| 2023 | $3,215 | $88,900 | $12,800 | $76,100 |
| 2022 | $3,180 | $88,900 | $12,800 | $76,100 |
| 2021 | $3,099 | $88,900 | $12,800 | $76,100 |
| 2020 | $3,010 | $88,900 | $12,800 | $76,100 |
| 2019 | $2,638 | $88,900 | $12,800 | $76,100 |
| 2018 | $2,577 | $88,900 | $12,800 | $76,100 |
| 2017 | $2,501 | $88,900 | $12,800 | $76,100 |
| 2016 | $2,494 | $88,900 | $12,800 | $76,100 |
| 2015 | $2,235 | $88,900 | $12,800 | $76,100 |
| 2014 | $2,235 | $88,900 | $12,800 | $76,100 |
Source: Public Records
Map
Nearby Homes
- 153 King William St Unit 153
- 117 W Shetland Ct
- 7 E Galloway Ct
- 305 Kinross Dr
- 313 Chickory Way
- 30 Julie Ln
- 28 Buttercup Cir
- 11 Buttercup Cir
- 0001 Leahy Dr
- 3 Leahy Dr
- 2 Leahy Dr
- 104 Leahy Dr
- 405 Leahy Dr
- 402 Leahy Dr
- 406 Leahy Dr
- 512 Briar Ln
- 117 Madison Dr
- 1002 Dixon Dr
- 306 Willa Rd
- 105 Tanglewood Ln
Your Personal Tour Guide
Ask me questions while you tour the home.