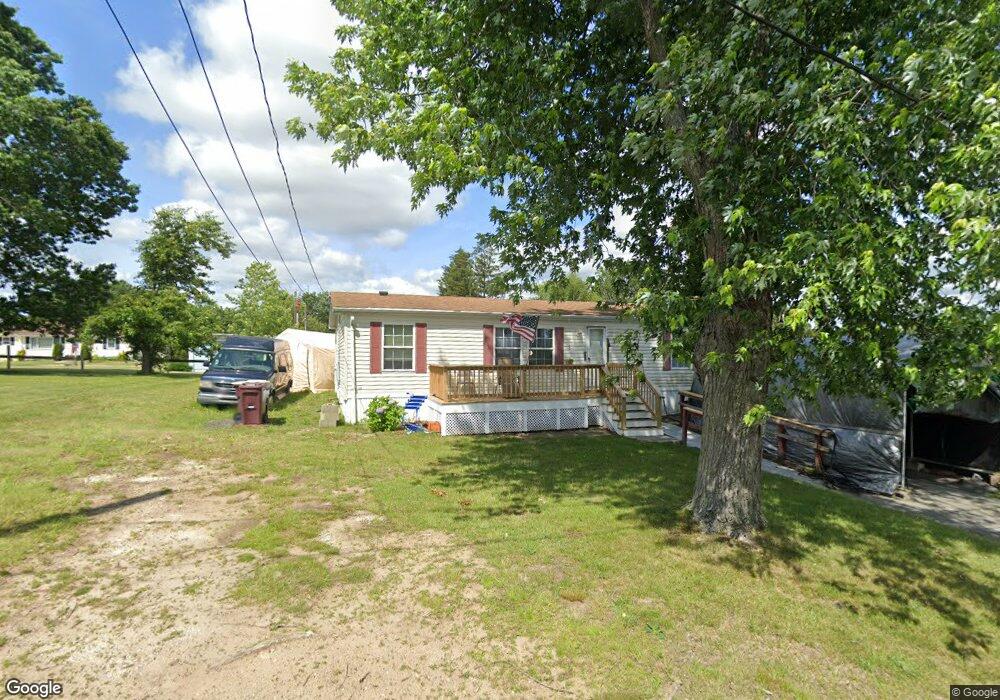
7 Maple St Acushnet, MA 02743
North Fairhaven NeighborhoodEstimated Value: $303,000 - $480,000
Studio
2
Baths
1,080
Sq Ft
$368/Sq Ft
Est. Value
About This Home
This home is located at 7 Maple St, Acushnet, MA 02743 and is currently estimated at $397,338, approximately $367 per square foot. 7 Maple St is a home located in Bristol County with nearby schools including Acushnet Elementary School, Albert F Ford Middle School, and St Francis Xavier Elementary School.
Ownership History
Date
Name
Owned For
Owner Type
Purchase Details
Closed on
Jan 31, 2020
Sold by
Vincent Anthony M
Bought by
Anthony M Vincent T
Current Estimated Value
Purchase Details
Closed on
Jul 3, 1996
Sold by
Silva Joan P
Bought by
Vincent Anthony M
Home Financials for this Owner
Home Financials are based on the most recent Mortgage that was taken out on this home.
Original Mortgage
$87,720
Interest Rate
7.98%
Mortgage Type
Purchase Money Mortgage
Create a Home Valuation Report for This Property
The Home Valuation Report is an in-depth analysis detailing your home's value as well as a comparison with similar homes in the area
Home Values in the Area
Average Home Value in this Area
Purchase History
| Date | Buyer | Sale Price | Title Company |
|---|---|---|---|
| Anthony M Vincent T | -- | None Available | |
| Vincent Anthony M | $42,000 | -- |
Source: Public Records
Mortgage History
| Date | Status | Borrower | Loan Amount |
|---|---|---|---|
| Previous Owner | Vincent Anthony M | $98,000 | |
| Previous Owner | Vincent Anthony M | $87,000 | |
| Previous Owner | Vincent Anthony M | $87,720 |
Source: Public Records
Tax History
| Year | Tax Paid | Tax Assessment Tax Assessment Total Assessment is a certain percentage of the fair market value that is determined by local assessors to be the total taxable value of land and additions on the property. | Land | Improvement |
|---|---|---|---|---|
| 2025 | $33 | $306,200 | $89,000 | $217,200 |
| 2024 | $3,161 | $277,000 | $84,800 | $192,200 |
| 2023 | $3,056 | $254,700 | $76,600 | $178,100 |
| 2022 | $3,053 | $230,100 | $72,400 | $157,700 |
| 2021 | $2,906 | $210,100 | $72,400 | $137,700 |
| 2020 | $2,929 | $210,100 | $72,400 | $137,700 |
| 2019 | $2,774 | $195,600 | $64,100 | $131,500 |
| 2018 | $1,889 | $185,800 | $64,100 | $121,700 |
| 2017 | $2,553 | $176,800 | $64,100 | $112,700 |
| 2016 | $2,505 | $172,400 | $64,100 | $108,300 |
| 2015 | $2,373 | $166,200 | $64,100 | $102,100 |
Source: Public Records
Map
Nearby Homes
Your Personal Tour Guide
Ask me questions while you tour the home.