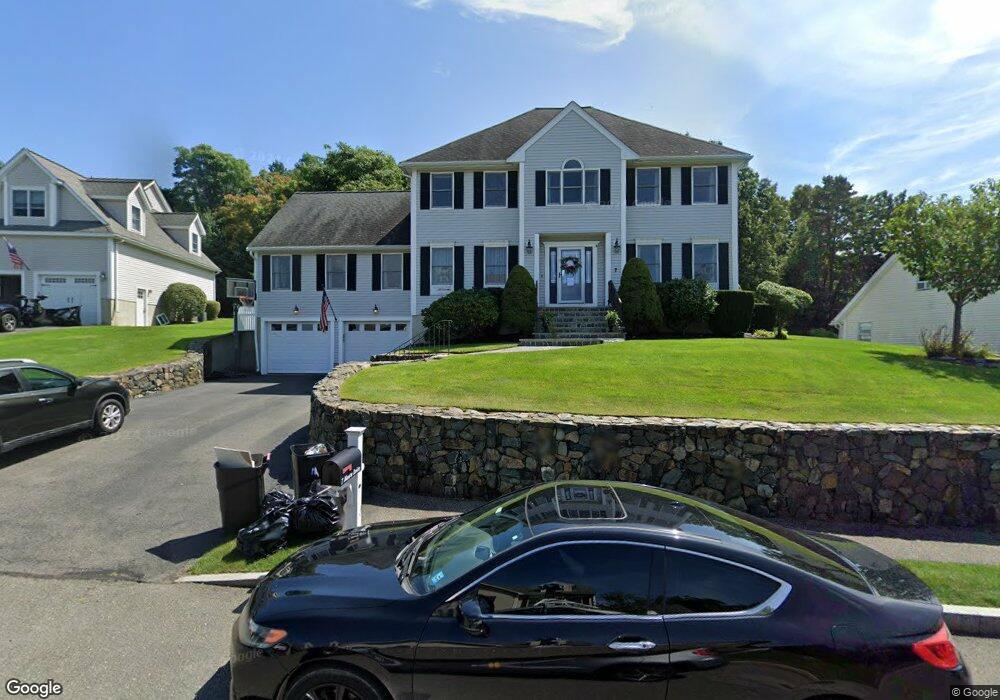
7 Mawn Dr Woburn, MA 01801
Cummingsville NeighborhoodEstimated Value: $1,258,307 - $1,421,000
4
Beds
4
Baths
3,200
Sq Ft
$412/Sq Ft
Est. Value
About This Home
This home is located at 7 Mawn Dr, Woburn, MA 01801 and is currently estimated at $1,318,827, approximately $412 per square foot. 7 Mawn Dr is a home located in Middlesex County with nearby schools including Hurld Elementary School, Daniel L. Joyce Middle School, and Woburn High School.
Ownership History
Date
Name
Owned For
Owner Type
Purchase Details
Closed on
Feb 14, 2025
Sold by
Nigro Robert A and Nigro Heather V
Bought by
Robert A Nigro T A and Robert Nigro
Current Estimated Value
Purchase Details
Closed on
May 19, 2008
Sold by
Roselli John M and Roselli Tara M
Bought by
Nigro Heather V and Nigro Robert A
Purchase Details
Closed on
Nov 30, 2000
Sold by
Daley John A and Daley Pamela H
Bought by
Hatch-Weatherhead Tara and Roselli John M
Purchase Details
Closed on
Mar 7, 2000
Sold by
Whit Bldrs Supply Inc
Bought by
Young Elizabeth M and Bliss Daniel W
Purchase Details
Closed on
Jun 28, 1999
Sold by
Whit Bldrs Supply Inc
Bought by
Daley John A and Daley Pamela H
Create a Home Valuation Report for This Property
The Home Valuation Report is an in-depth analysis detailing your home's value as well as a comparison with similar homes in the area
Home Values in the Area
Average Home Value in this Area
Purchase History
| Date | Buyer | Sale Price | Title Company |
|---|---|---|---|
| Robert A Nigro T A | -- | None Available | |
| Robert A Nigro T A | -- | None Available | |
| Nigro Heather V | $656,500 | -- | |
| Nigro Heather V | $656,500 | -- | |
| Hatch-Weatherhead Tara | $440,000 | -- | |
| Young Elizabeth M | $399,900 | -- | |
| Daley John A | $399,900 | -- |
Source: Public Records
Mortgage History
| Date | Status | Borrower | Loan Amount |
|---|---|---|---|
| Previous Owner | Daley John A | $502,000 | |
| Previous Owner | Daley John A | $504,000 |
Source: Public Records
Tax History Compared to Growth
Tax History
| Year | Tax Paid | Tax Assessment Tax Assessment Total Assessment is a certain percentage of the fair market value that is determined by local assessors to be the total taxable value of land and additions on the property. | Land | Improvement |
|---|---|---|---|---|
| 2025 | $9,394 | $1,100,000 | $385,900 | $714,100 |
| 2024 | $8,443 | $1,047,500 | $367,600 | $679,900 |
| 2023 | $8,226 | $945,500 | $334,200 | $611,300 |
| 2022 | $8,076 | $864,700 | $290,800 | $573,900 |
| 2021 | $7,822 | $838,400 | $277,000 | $561,400 |
| 2020 | $7,491 | $803,800 | $277,000 | $526,800 |
| 2019 | $7,272 | $765,500 | $263,900 | $501,600 |
| 2018 | $7,042 | $712,000 | $242,200 | $469,800 |
| 2017 | $6,603 | $664,300 | $230,700 | $433,600 |
| 2016 | $6,414 | $638,200 | $215,700 | $422,500 |
| 2015 | $6,210 | $610,600 | $201,600 | $409,000 |
| 2014 | $5,986 | $573,400 | $201,600 | $371,800 |
Source: Public Records
Map
Nearby Homes
- 7 Locust St
- 12 Cassidy Dr
- 18 Beacon St Unit 18
- 31 Arlington Rd Unit 1-6
- 17 Wright St
- 27 Arlington Rd Unit 1-6
- 29 Arlington Rd Unit 4
- 52 Pleasant St
- 26 Flagg St
- 37 1/2 Chestnut St
- 15 Sturgis St
- 21 Franklin St
- 11 Hovey St
- 477 Main St
- 7 Prospect St
- 166 Place Ln Unit 166
- 168 Place Ln
- 18 Hamilton Rd
- 18 Winn Valley Dr
- 14 Church Ave