Estimated Value: $305,000 - $418,000
3
Beds
2
Baths
1,429
Sq Ft
$263/Sq Ft
Est. Value
About This Home
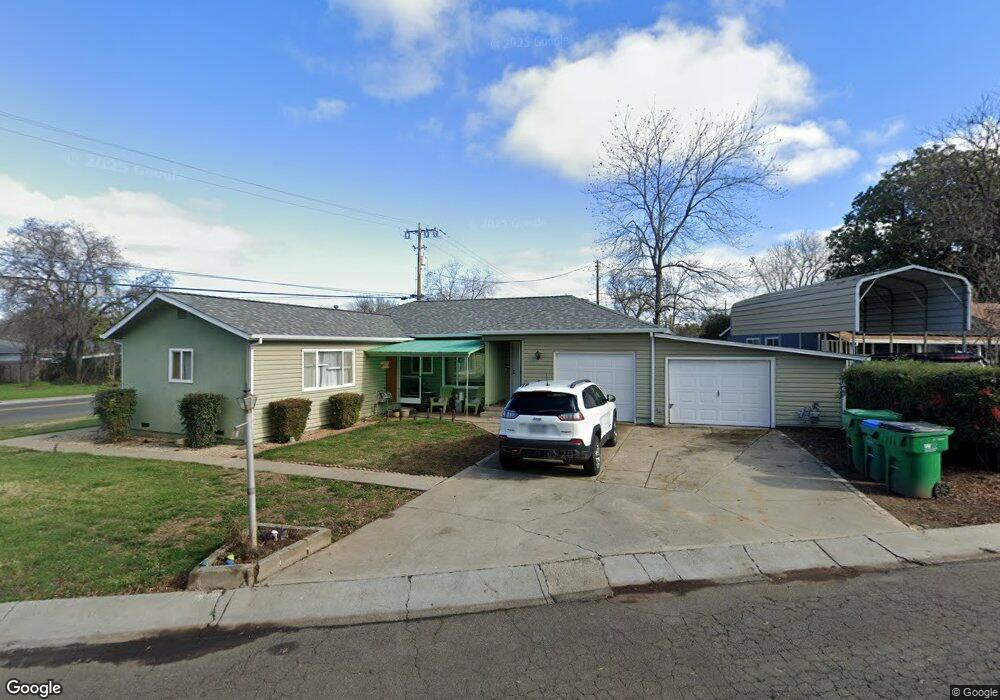
This home is located at 7 Mione Way, Chico, CA 95926 and is currently estimated at $376,081, approximately $263 per square foot. 7 Mione Way is a home located in Butte County with nearby schools including Neal Dow Elementary School, Bidwell Junior High School, and Pleasant Valley High School.
Ownership History
Date
Name
Owned For
Owner Type
Purchase Details
Closed on
Nov 7, 2013
Sold by
Parker Robert F and Estate Of Stephen R Parker
Bought by
Parker Robert F
Current Estimated Value
Purchase Details
Closed on
Aug 14, 2000
Sold by
Windsor Donald G and Windsor Dorothy M
Bought by
Parker Stephen R
Home Financials for this Owner
Home Financials are based on the most recent Mortgage that was taken out on this home.
Original Mortgage
$102,000
Interest Rate
8.16%
Purchase Details
Closed on
Jul 26, 2000
Sold by
Windsor Donald G and Windsor Dorothy M
Bought by
Windsor Donald G and Windsor Dorothy M
Home Financials for this Owner
Home Financials are based on the most recent Mortgage that was taken out on this home.
Original Mortgage
$102,000
Interest Rate
8.16%
Create a Home Valuation Report for This Property
The Home Valuation Report is an in-depth analysis detailing your home's value as well as a comparison with similar homes in the area
Home Values in the Area
Average Home Value in this Area
Purchase History
| Date | Buyer | Sale Price | Title Company |
|---|---|---|---|
| Parker Robert F | -- | None Available | |
| Parker Stephen R | $127,500 | Mid Valley Title & Escrow Co | |
| Windsor Donald G | -- | -- |
Source: Public Records
Mortgage History
| Date | Status | Borrower | Loan Amount |
|---|---|---|---|
| Closed | Parker Stephen R | $102,000 |
Source: Public Records
Tax History Compared to Growth
Tax History
| Year | Tax Paid | Tax Assessment Tax Assessment Total Assessment is a certain percentage of the fair market value that is determined by local assessors to be the total taxable value of land and additions on the property. | Land | Improvement |
|---|---|---|---|---|
| 2025 | $2,743 | $252,429 | $110,821 | $141,608 |
| 2024 | $2,743 | $247,481 | $108,649 | $138,832 |
| 2023 | $2,710 | $242,629 | $106,519 | $136,110 |
| 2022 | $2,666 | $237,873 | $104,431 | $133,442 |
| 2021 | $2,616 | $233,210 | $102,384 | $130,826 |
| 2020 | $2,609 | $230,820 | $101,335 | $129,485 |
| 2019 | $2,562 | $226,296 | $99,349 | $126,947 |
| 2018 | $2,515 | $221,859 | $97,401 | $124,458 |
| 2017 | $2,464 | $217,510 | $95,492 | $122,018 |
| 2016 | $2,249 | $213,246 | $93,620 | $119,626 |
| 2015 | $2,249 | $210,044 | $92,214 | $117,830 |
| 2014 | $2,207 | $205,930 | $90,408 | $115,522 |
Source: Public Records
Map
Nearby Homes
- 656 Jardin Way
- 2 Kingston Cir
- 1276 Dale Way
- 1277 Howard Dr
- 6 Spirit Ct
- 13 Kimberlee Ln
- 16 Petaluma Ct
- 9 Gazania Ct
- 2423 Ceanothus Ave
- 15 La Casa Ct
- 3 Sunflower Ct
- 1603 Plumas Way
- 1094 Manzanita Ave
- 1291 East Ave
- 1125 Sheridan Ave Unit 28
- 1125 Sheridan Ave Unit 56
- 2165 Ceres Ave
- 1186 Patricia Dr
- 9 Trieste Way
- 1420 Sherman Ave