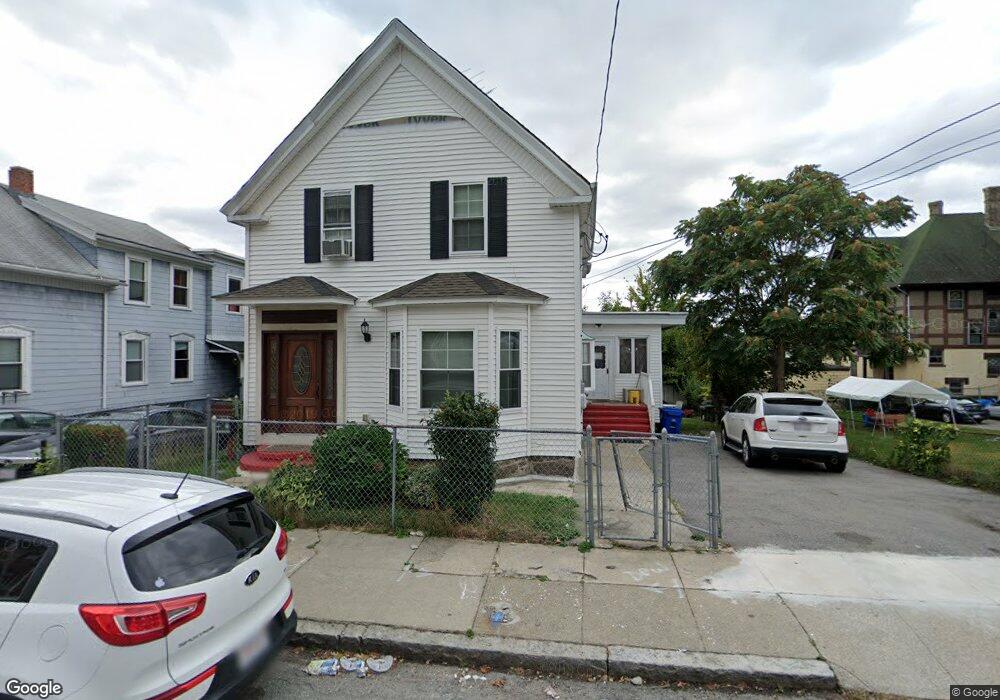
7 Montgomery St Lawrence, MA 01841
Prospect Hill-Back Bay NeighborhoodEstimated Value: $473,000 - $546,000
3
Beds
1
Bath
1,487
Sq Ft
$333/Sq Ft
Est. Value
About This Home
This home is located at 7 Montgomery St, Lawrence, MA 01841 and is currently estimated at $494,860, approximately $332 per square foot. 7 Montgomery St is a home located in Essex County with nearby schools including School For Exceptional Studies, Community Day Charter Public School - Gateway, and Lawrence Family Development Charter School.
Ownership History
Date
Name
Owned For
Owner Type
Purchase Details
Closed on
Aug 29, 2005
Sold by
Manzi Mary G and Manzi Sheila K
Bought by
Nunez Ana E
Current Estimated Value
Home Financials for this Owner
Home Financials are based on the most recent Mortgage that was taken out on this home.
Original Mortgage
$184,800
Outstanding Balance
$97,810
Interest Rate
5.68%
Mortgage Type
Purchase Money Mortgage
Estimated Equity
$397,050
Create a Home Valuation Report for This Property
The Home Valuation Report is an in-depth analysis detailing your home's value as well as a comparison with similar homes in the area
Home Values in the Area
Average Home Value in this Area
Purchase History
| Date | Buyer | Sale Price | Title Company |
|---|---|---|---|
| Nunez Ana E | $231,000 | -- |
Source: Public Records
Mortgage History
| Date | Status | Borrower | Loan Amount |
|---|---|---|---|
| Open | Nunez Ana E | $184,800 |
Source: Public Records
Tax History
| Year | Tax Paid | Tax Assessment Tax Assessment Total Assessment is a certain percentage of the fair market value that is determined by local assessors to be the total taxable value of land and additions on the property. | Land | Improvement |
|---|---|---|---|---|
| 2025 | $3,717 | $422,400 | $133,800 | $288,600 |
| 2024 | $3,259 | $352,300 | $99,000 | $253,300 |
| 2023 | $2,940 | $289,400 | $96,500 | $192,900 |
| 2022 | $3,146 | $275,000 | $96,500 | $178,500 |
| 2021 | $3,041 | $247,800 | $96,500 | $151,300 |
| 2020 | $2,960 | $238,100 | $86,800 | $151,300 |
| 2019 | $2,990 | $218,600 | $78,000 | $140,600 |
| 2018 | $2,625 | $183,300 | $67,100 | $116,200 |
| 2017 | $2,592 | $169,000 | $66,300 | $102,700 |
| 2016 | $2,278 | $146,900 | $48,400 | $98,500 |
| 2015 | $2,221 | $146,900 | $48,400 | $98,500 |
Source: Public Records
Map
Nearby Homes
- 129-131 Lexington St
- 5 Kendrick St
- 25-27 Bicknell Ave
- 131A Lawrence St Unit 40
- 7-9 Bennington St
- 192 Union St
- 14 Court St
- 434-438 Hampshire St
- 39 Swan Ave
- 162 E Haverhill St
- 97 Kenwood Rd
- 27 Willow St Unit A
- 89 Newbury St Unit 89B
- 91 Summer St Unit 2
- 173 Jackson St
- 80-82 Haverhill St
- 12 Annette St
- 29 Center St
- 109 Ferry St
- 71-75 Common St
- 9 Montgomery St
- 3 Montgomery St
- 11 Montgomery St
- 71 Knox St Unit 73
- 71 Knox St Unit 2
- 125 Berkeley St Unit 1
- 125 Berkeley St
- 75 Knox St
- 123 Berkeley St Unit 1
- 46 Montgomery St
- 4 Montgomery St
- 63 Knox St
- 127 Berkeley St
- 2A Montgomery St
- 2 Montgomery St Unit 3
- 2 Montgomery St
- 2 Montgomery St Unit 2
- 13 Montgomery St Unit 15
- 59 Knox St Unit 59
- 8 Montgomery St
Your Personal Tour Guide
Ask me questions while you tour the home.