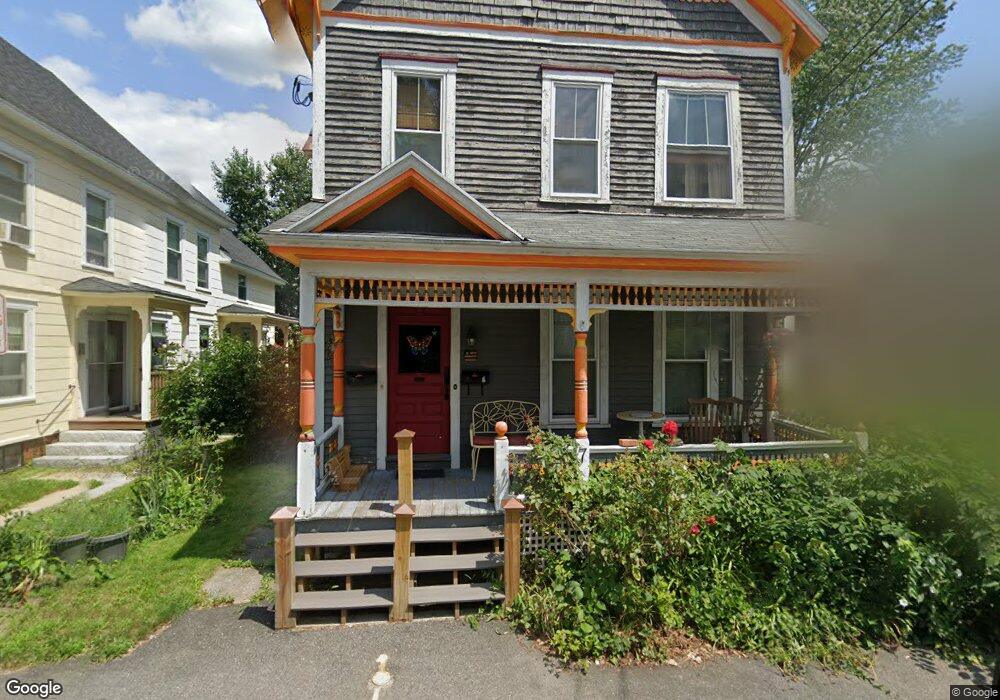
7 Morton St Concord, NH 03301
South End NeighborhoodEstimated Value: $429,983 - $501,000
4
Beds
2
Baths
2,117
Sq Ft
$216/Sq Ft
Est. Value
About This Home
This home is located at 7 Morton St, Concord, NH 03301 and is currently estimated at $456,246, approximately $215 per square foot. 7 Morton St is a home located in Merrimack County with nearby schools including Abbot-Downing School, Rundlett Middle School, and Concord High School.
Ownership History
Date
Name
Owned For
Owner Type
Purchase Details
Closed on
Oct 6, 2025
Sold by
Holm Ian N and Dobbins Donna L
Bought by
Holm Ian N
Current Estimated Value
Home Financials for this Owner
Home Financials are based on the most recent Mortgage that was taken out on this home.
Original Mortgage
$145,000
Outstanding Balance
$144,870
Interest Rate
6.56%
Mortgage Type
New Conventional
Estimated Equity
$311,376
Purchase Details
Closed on
Sep 29, 1998
Sold by
Labarre Robert L and Labarre Antoinette D
Bought by
Holm Ian N
Home Financials for this Owner
Home Financials are based on the most recent Mortgage that was taken out on this home.
Original Mortgage
$77,900
Interest Rate
6.87%
Mortgage Type
Purchase Money Mortgage
Create a Home Valuation Report for This Property
The Home Valuation Report is an in-depth analysis detailing your home's value as well as a comparison with similar homes in the area
Home Values in the Area
Average Home Value in this Area
Purchase History
| Date | Buyer | Sale Price | Title Company |
|---|---|---|---|
| Holm Ian N | -- | -- | |
| Holm Ian N | $82,000 | -- |
Source: Public Records
Mortgage History
| Date | Status | Borrower | Loan Amount |
|---|---|---|---|
| Open | Holm Ian N | $145,000 | |
| Previous Owner | Holm Ian N | $202,808 | |
| Previous Owner | Holm Ian N | $221,016 | |
| Previous Owner | Holm Ian N | $77,900 |
Source: Public Records
Tax History Compared to Growth
Tax History
| Year | Tax Paid | Tax Assessment Tax Assessment Total Assessment is a certain percentage of the fair market value that is determined by local assessors to be the total taxable value of land and additions on the property. | Land | Improvement |
|---|---|---|---|---|
| 2024 | $7,462 | $269,500 | $92,300 | $177,200 |
| 2023 | $7,239 | $269,500 | $92,300 | $177,200 |
| 2022 | $6,977 | $269,500 | $92,300 | $177,200 |
| 2021 | $7,169 | $285,400 | $92,300 | $193,100 |
| 2020 | $6,891 | $257,500 | $77,100 | $180,400 |
| 2019 | $6,728 | $242,200 | $73,800 | $168,400 |
| 2018 | $6,811 | $241,600 | $73,800 | $167,800 |
| 2017 | $6,645 | $235,300 | $72,400 | $162,900 |
| 2016 | $5,902 | $213,300 | $72,400 | $140,900 |
| 2015 | $5,662 | $189,400 | $65,900 | $123,500 |
| 2014 | $5,078 | $189,400 | $65,900 | $123,500 |
| 2013 | -- | $177,000 | $65,900 | $111,100 |
| 2012 | -- | $167,400 | $65,900 | $101,500 |
Source: Public Records
Map
Nearby Homes
- 0 Spruce St Unit 88
- 33 Spruce St
- 14 Downing St
- 14-16 Perley St
- 10 Perley St
- 24 Pierce St
- 87 S Main St Unit 2
- 47 South St
- 105 S Main St
- 12 Avon St
- 122 South St
- 4 Fayette St
- 54 Pleasant St Unit 8
- 0 South St Unit 4969509
- 15 Wilson Ave
- 22 Wilson Ave
- 376 S Main St
- 7 Highridge Trail
- 22 Longmeadow Dr
- 41 Longmeadow Dr
- 9 Morton St Unit 11
- 5 1/2 Morton St
- 9-11 Morton St
- 11 Morton St
- 6 Morton St
- 3 Morton St
- 100 S State St
- 4 1/2 Morton St
- 13 Morton St
- 13 Morton St Unit Second Floor
- 102 S State St Unit 104
- 8 Morton St
- 10 Morton St
- 29-31 West St
- 104A S State St
- 98 S State St
- 33 West St
- 27 1/2 West St
- 27-27.5 West St
- 106 S State St