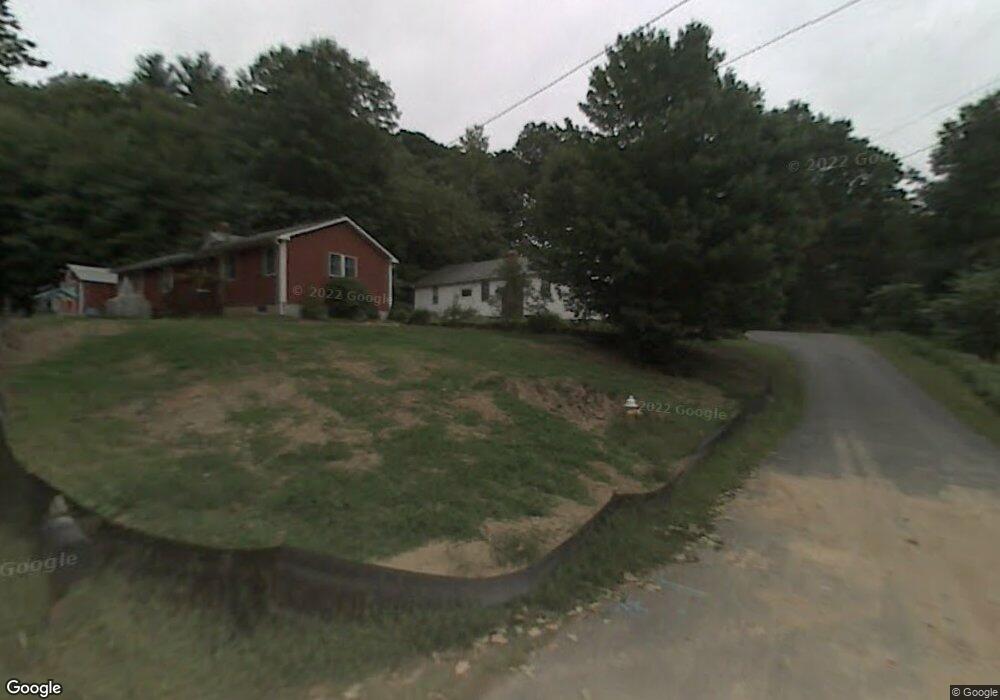
7 N Bend Rd Worcester, MA 01602
West Tatnuck NeighborhoodEstimated Value: $368,000 - $488,000
3
Beds
1
Bath
1,036
Sq Ft
$393/Sq Ft
Est. Value
About This Home
This home is located at 7 N Bend Rd, Worcester, MA 01602 and is currently estimated at $406,948, approximately $392 per square foot. 7 N Bend Rd is a home located in Worcester County with nearby schools including Tatnuck Magnet School, Chandler Magnet, and Jacob Hiatt Magnet School.
Ownership History
Date
Name
Owned For
Owner Type
Purchase Details
Closed on
Sep 1, 2017
Sold by
Wells Fargo Bank Na
Bought by
Bcr Properties Llc
Current Estimated Value
Purchase Details
Closed on
Jan 18, 2017
Sold by
Volk Erik C
Bought by
Wells Fargo Bank Na
Purchase Details
Closed on
May 7, 2009
Sold by
King Laura L
Bought by
Volk Erik C
Home Financials for this Owner
Home Financials are based on the most recent Mortgage that was taken out on this home.
Original Mortgage
$161,912
Interest Rate
4.9%
Mortgage Type
Purchase Money Mortgage
Purchase Details
Closed on
Nov 23, 1999
Sold by
Fay Peter R
Bought by
King Laura L
Home Financials for this Owner
Home Financials are based on the most recent Mortgage that was taken out on this home.
Original Mortgage
$92,000
Interest Rate
7.76%
Mortgage Type
Purchase Money Mortgage
Purchase Details
Closed on
Aug 17, 1999
Sold by
Fay Peter R
Bought by
Valente Construction
Purchase Details
Closed on
Feb 2, 1988
Sold by
Wilkinson Julia
Bought by
Fay Peter R
Create a Home Valuation Report for This Property
The Home Valuation Report is an in-depth analysis detailing your home's value as well as a comparison with similar homes in the area
Home Values in the Area
Average Home Value in this Area
Purchase History
| Date | Buyer | Sale Price | Title Company |
|---|---|---|---|
| Bcr Properties Llc | $90,000 | -- | |
| Wells Fargo Bank Na | $142,080 | -- | |
| Volk Erik C | $164,900 | -- | |
| King Laura L | $115,000 | -- | |
| Valente Construction | $95,000 | -- | |
| Fay Peter R | $73,500 | -- |
Source: Public Records
Mortgage History
| Date | Status | Borrower | Loan Amount |
|---|---|---|---|
| Previous Owner | Volk Erik C | $161,912 | |
| Previous Owner | Fay Peter R | $131,000 | |
| Previous Owner | Fay Peter R | $107,400 | |
| Previous Owner | Fay Peter R | $92,000 |
Source: Public Records
Tax History Compared to Growth
Tax History
| Year | Tax Paid | Tax Assessment Tax Assessment Total Assessment is a certain percentage of the fair market value that is determined by local assessors to be the total taxable value of land and additions on the property. | Land | Improvement |
|---|---|---|---|---|
| 2025 | $4,044 | $306,600 | $119,800 | $186,800 |
| 2024 | $3,961 | $288,100 | $119,800 | $168,300 |
| 2023 | $3,802 | $265,100 | $104,200 | $160,900 |
| 2022 | $3,352 | $220,400 | $83,400 | $137,000 |
| 2021 | $3,183 | $195,500 | $66,800 | $128,700 |
| 2020 | $3,080 | $181,200 | $66,700 | $114,500 |
| 2019 | $2,905 | $161,400 | $60,400 | $101,000 |
| 2018 | $2,842 | $150,300 | $60,400 | $89,900 |
| 2017 | $2,854 | $148,500 | $60,400 | $88,100 |
| 2016 | $2,749 | $133,400 | $45,900 | $87,500 |
| 2015 | $2,677 | $133,400 | $45,900 | $87,500 |
| 2014 | $2,607 | $133,400 | $45,900 | $87,500 |
Source: Public Records
Map
Nearby Homes
- 155 Tory Fort Ln
- 148A Tory Fort Ln
- 12 Pinebrook Ln
- 9 Newburn Rd
- 25 Salisbury Hill Blvd Unit 64
- 25 Salisbury Hill Blvd Unit 69
- 25 Salisbury Hill Blvd Unit 67
- 25 Salisbury Hill Blvd Unit 51
- 25 Salisbury Hill Blvd Unit 65
- 3 Carter Way
- 15 Wildrose Ave
- 5 Forest Hill Dr
- 20 Wedgewood Rd
- 10 Salisbury Hill Blvd Unit 75
- 58 Wedgewood Rd
- 12 Merlin Ct
- 10 Joppa Rd
- 12 Copperfield Rd
- 5 Edwidge St
- 1029 Pleasant St Unit 19
- 5 N Bend Rd
- 3 N Bend Rd
- 6 N Bend Rd
- 4 N Bend Rd
- 87A Tory Fort Ln Unit a
- 87A Tory Fort Ln
- 87 Tory Fort Ln Unit a
- 87 Tory Fort Ln
- 87 Tory Fort Ln
- 85 Tory Fort Ln
- 85 Tory Fort Ln
- 12 Dawson Rd
- 73 Tory Fort Ln
- 8 N Bend Rd
- 10A Dawson Rd
- 14 Dawson Rd
- 89 Tory Fort Ln
- 78 Tory Fort Ln
- 26 Dawson Rd
- 5 Dawson Rd