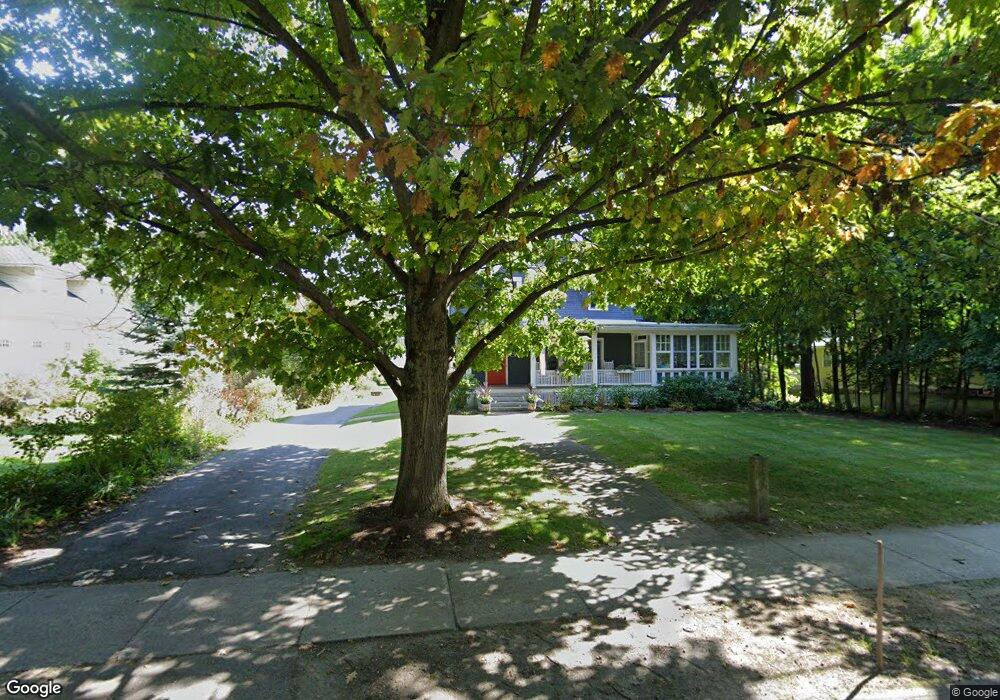
7 N Park St Hanover, NH 03755
Estimated Value: $1,613,000 - $2,103,000
4
Beds
4
Baths
2,494
Sq Ft
$756/Sq Ft
Est. Value
About This Home
This home is located at 7 N Park St, Hanover, NH 03755 and is currently estimated at $1,885,610, approximately $756 per square foot. 7 N Park St is a home located in Grafton County with nearby schools including Bernice A. Ray School, Frances C. Richmond School, and Hanover High School.
Ownership History
Date
Name
Owned For
Owner Type
Purchase Details
Closed on
Jan 29, 2021
Sold by
Matter Drew M and Schell-Matter Susan
Bought by
Schell M P and Schell S
Current Estimated Value
Purchase Details
Closed on
Jun 10, 2015
Sold by
Dwyer 3Rd Edward J and Dwyer Linda S
Bought by
Matter Drew M and Matter Susan S
Purchase Details
Closed on
Aug 29, 2007
Sold by
Dartmouth College
Bought by
Dwyer Edward J and Dwyer Linda S
Home Financials for this Owner
Home Financials are based on the most recent Mortgage that was taken out on this home.
Original Mortgage
$417,000
Interest Rate
6.71%
Mortgage Type
Purchase Money Mortgage
Create a Home Valuation Report for This Property
The Home Valuation Report is an in-depth analysis detailing your home's value as well as a comparison with similar homes in the area
Home Values in the Area
Average Home Value in this Area
Purchase History
| Date | Buyer | Sale Price | Title Company |
|---|---|---|---|
| Schell M P | -- | None Available | |
| Schell M P | -- | None Available | |
| Schell M P | -- | None Available | |
| Matter Drew M | $837,533 | -- | |
| Dwyer Edward J | $700,000 | -- | |
| Matter Drew M | $837,533 | -- | |
| Dwyer Edward J | $700,000 | -- |
Source: Public Records
Mortgage History
| Date | Status | Borrower | Loan Amount |
|---|---|---|---|
| Previous Owner | Dwyer Edward J | $500,000 | |
| Previous Owner | Dwyer Edward J | $416,000 | |
| Previous Owner | Dwyer Edward J | $417,000 |
Source: Public Records
Tax History
| Year | Tax Paid | Tax Assessment Tax Assessment Total Assessment is a certain percentage of the fair market value that is determined by local assessors to be the total taxable value of land and additions on the property. | Land | Improvement |
|---|---|---|---|---|
| 2024 | $23,864 | $1,238,400 | $530,100 | $708,300 |
| 2023 | $22,960 | $1,238,400 | $530,100 | $708,300 |
| 2022 | $22,031 | $1,238,400 | $530,100 | $708,300 |
| 2021 | $21,845 | $1,238,400 | $530,100 | $708,300 |
| 2020 | $22,591 | $1,117,800 | $707,200 | $410,600 |
| 2019 | $21,935 | $1,100,600 | $707,200 | $393,400 |
| 2018 | $15,510 | $1,084,300 | $707,200 | $377,100 |
| 2017 | $15,134 | $704,300 | $304,100 | $400,200 |
| 2016 | $14,809 | $695,600 | $304,100 | $391,500 |
| 2015 | $14,524 | $695,600 | $304,100 | $391,500 |
| 2014 | $13,933 | $695,600 | $304,100 | $391,500 |
| 2013 | $13,432 | $695,600 | $304,100 | $391,500 |
| 2012 | $12,906 | $698,000 | $310,000 | $388,000 |
Source: Public Records
Map
Nearby Homes
- 33 E Wheelock St
- 126 Brook Hollow
- 2 Hilton Field Ln
- 37 Low Rd
- 4 Occom Ridge
- 23 School St
- 4 Haskins Rd
- 26 Low Rd
- 85 Lebanon St
- 32 Melview Ridge
- 25 Hemlock Rd
- 53 Lyme Rd Unit 35
- 7 Birchbrook St
- 51 Loveland Rd
- 253 Main St
- 18 Elm St
- 187 Hopson Rd
- 195 Willey Hill Rd
- 0 Barrister Dr Unit 3
- 46A Barrister Dr Unit 205
Your Personal Tour Guide
Ask me questions while you tour the home.