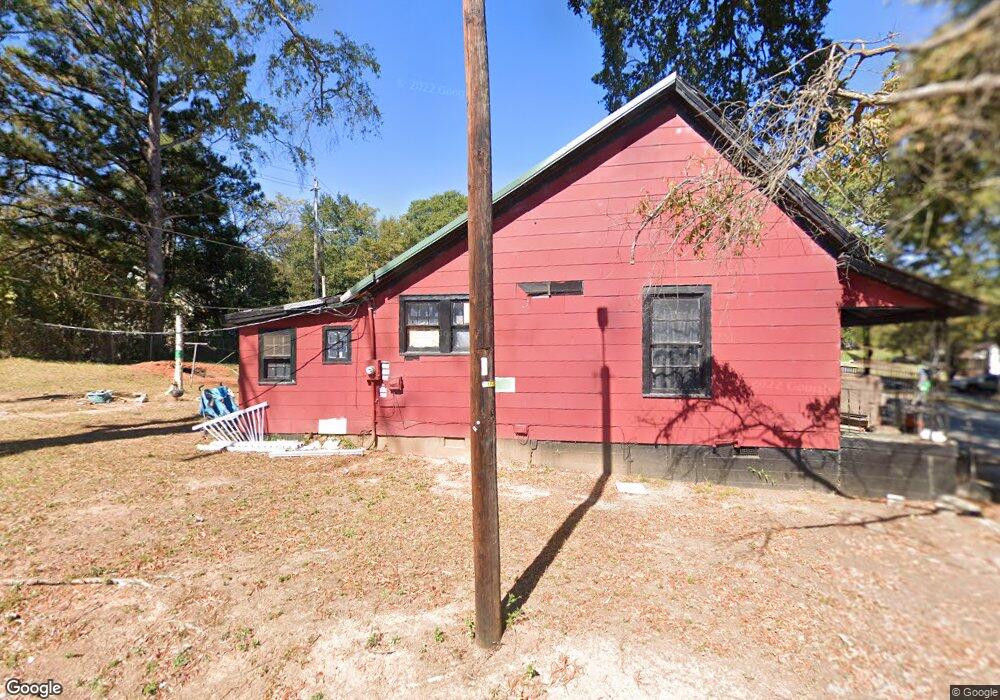
7 O St Anderson, SC 29625
Estimated Value: $41,000 - $107,000
2
Beds
--
Bath
1,037
Sq Ft
$60/Sq Ft
Est. Value
About This Home
This home is located at 7 O St, Anderson, SC 29625 and is currently estimated at $62,656, approximately $60 per square foot. 7 O St is a home located in Anderson County with nearby schools including Centerville Elementary School, Westside High School, and Anderson Institute of Technology.
Ownership History
Date
Name
Owned For
Owner Type
Purchase Details
Closed on
Feb 26, 2025
Sold by
Burkey Connie
Bought by
Emerald Hill Investments Llc
Current Estimated Value
Home Financials for this Owner
Home Financials are based on the most recent Mortgage that was taken out on this home.
Original Mortgage
$93,000
Outstanding Balance
$59,141
Interest Rate
7.04%
Mortgage Type
Construction
Estimated Equity
$3,515
Purchase Details
Closed on
Aug 16, 2012
Sold by
Murph Corene S
Bought by
Burkey Connie
Create a Home Valuation Report for This Property
The Home Valuation Report is an in-depth analysis detailing your home's value as well as a comparison with similar homes in the area
Home Values in the Area
Average Home Value in this Area
Purchase History
| Date | Buyer | Sale Price | Title Company |
|---|---|---|---|
| Emerald Hill Investments Llc | $40,000 | None Listed On Document | |
| Emerald Hill Investments Llc | $40,000 | None Listed On Document | |
| Burkey Connie | $2,000 | -- |
Source: Public Records
Mortgage History
| Date | Status | Borrower | Loan Amount |
|---|---|---|---|
| Open | Emerald Hill Investments Llc | $93,000 | |
| Closed | Emerald Hill Investments Llc | $93,000 |
Source: Public Records
Tax History Compared to Growth
Tax History
| Year | Tax Paid | Tax Assessment Tax Assessment Total Assessment is a certain percentage of the fair market value that is determined by local assessors to be the total taxable value of land and additions on the property. | Land | Improvement |
|---|---|---|---|---|
| 2024 | $429 | $1,030 | $220 | $810 |
| 2023 | $429 | $1,030 | $220 | $810 |
| 2022 | $390 | $1,030 | $220 | $810 |
| 2021 | $368 | $900 | $210 | $690 |
| 2020 | $360 | $900 | $210 | $690 |
| 2019 | $360 | $900 | $210 | $690 |
| 2018 | $356 | $900 | $210 | $690 |
| 2017 | -- | $900 | $210 | $690 |
| 2016 | $351 | $890 | $210 | $680 |
| 2015 | $351 | $890 | $210 | $680 |
| 2014 | $342 | $890 | $210 | $680 |
Source: Public Records
Map
Nearby Homes