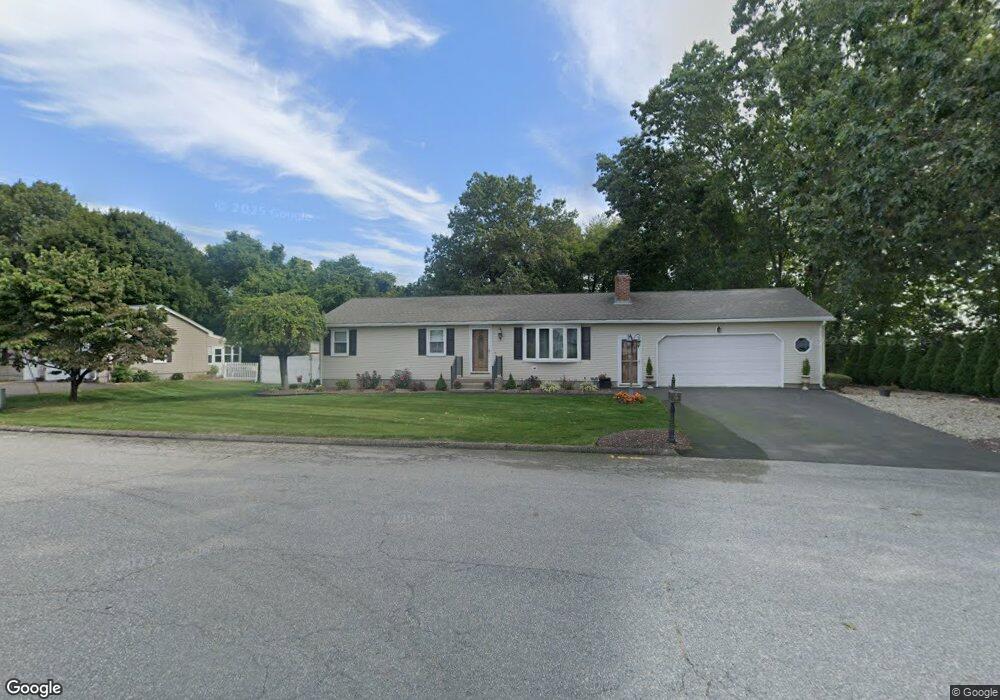
7 Old Lyman Rd Chicopee, MA 01020
Fairview NeighborhoodEstimated Value: $365,000 - $428,000
3
Beds
2
Baths
1,368
Sq Ft
$282/Sq Ft
Est. Value
About This Home
This home is located at 7 Old Lyman Rd, Chicopee, MA 01020 and is currently estimated at $385,192, approximately $281 per square foot. 7 Old Lyman Rd is a home located in Hampden County with nearby schools including Bowie Elementary School, Fairview Middle School, and Chicopee Comprehensive High School.
Ownership History
Date
Name
Owned For
Owner Type
Purchase Details
Closed on
May 23, 2007
Sold by
Catarino Joanne M and Page Joanne M
Bought by
Page Joanne M and Page Paul F
Current Estimated Value
Create a Home Valuation Report for This Property
The Home Valuation Report is an in-depth analysis detailing your home's value as well as a comparison with similar homes in the area
Home Values in the Area
Average Home Value in this Area
Purchase History
We collect this data history from publicly available records. To have your information removed, we recommend requesting removal directly through your county’s website.
| Date | Buyer | Sale Price | Title Company |
|---|---|---|---|
| Page Joanne M | -- | -- |
Source: Public Records
Tax History
| Year | Tax Paid | Tax Assessment Tax Assessment Total Assessment is a certain percentage of the fair market value that is determined by local assessors to be the total taxable value of land and additions on the property. | Land | Improvement |
|---|---|---|---|---|
| 2025 | $4,718 | $311,200 | $112,700 | $198,500 |
| 2024 | $4,474 | $303,100 | $110,400 | $192,700 |
| 2023 | $4,151 | $274,000 | $100,400 | $173,600 |
| 2022 | $3,994 | $235,100 | $87,300 | $147,800 |
| 2021 | $3,790 | $215,200 | $79,300 | $135,900 |
| 2020 | $3,640 | $208,500 | $81,500 | $127,000 |
| 2019 | $3,585 | $199,600 | $81,500 | $118,100 |
| 2018 | $3,499 | $191,100 | $77,700 | $113,400 |
| 2017 | $3,322 | $191,900 | $71,200 | $120,700 |
| 2016 | $3,331 | $197,000 | $71,200 | $125,800 |
| 2015 | $3,291 | $187,600 | $71,200 | $116,400 |
| 2014 | $1,645 | $187,600 | $71,200 | $116,400 |
Source: Public Records
Map
Nearby Homes
- 200 Royal St
- 20 Richmond Way
- 128 Ann St
- 76 Mitchell Dr
- 33 Guerin St
- 81 Mccarthy Ave
- 98 Greenpoint Cir
- 32 Yorktown Ct Unit 32
- 79 Beaudry Ave
- 523 James St
- 67 Manning St
- 28 New Ludlow Rd
- 125 Greenwood Terrace
- 68 Honeysuckle Dr
- 72 Honeysuckle Dr
- 125 Lynwood Dr Unit 6201D
- 14 Hillside Ave
- 106 Deslauriers St
- 1760 Westover Rd Unit 1
- 40 Pittroff Ave
Your Personal Tour Guide
Ask me questions while you tour the home.