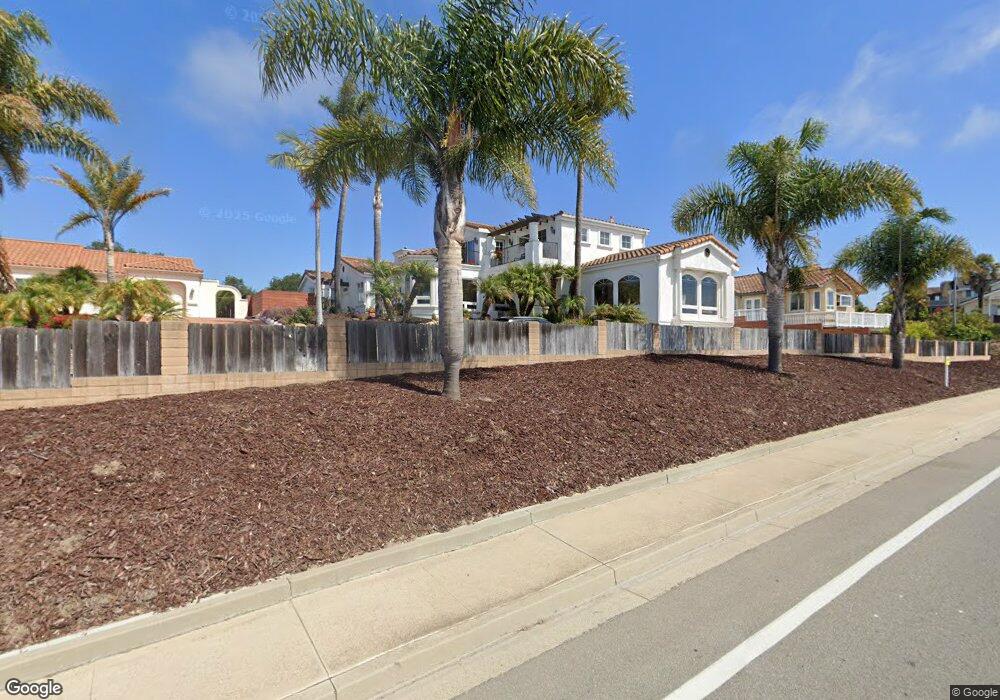
7 Paseo Ladera Ln Pismo Beach, CA 93449
Estimated Value: $1,171,000 - $1,784,000
4
Beds
4
Baths
3,085
Sq Ft
$478/Sq Ft
Est. Value
About This Home
This home is located at 7 Paseo Ladera Ln, Pismo Beach, CA 93449 and is currently estimated at $1,475,038, approximately $478 per square foot. 7 Paseo Ladera Ln is a home located in San Luis Obispo County with nearby schools including Judkins Middle School, Arroyo Grande High School, and Coastal Christian School.
Ownership History
Date
Name
Owned For
Owner Type
Purchase Details
Closed on
Apr 14, 2021
Sold by
Southern California Gas Company
Bought by
Nichols Scott and Nichols Sandra L
Current Estimated Value
Purchase Details
Closed on
Dec 17, 2003
Sold by
Nichols Scott and Nichols Sandy
Bought by
Nichols Scott and Nichols Sandra L
Purchase Details
Closed on
Mar 12, 2003
Sold by
Nichols Scott J
Bought by
Nichols Scott and Nichols Sandy
Purchase Details
Closed on
Sep 13, 2002
Sold by
Nichols Sandy
Bought by
Nichols Scott J
Home Financials for this Owner
Home Financials are based on the most recent Mortgage that was taken out on this home.
Original Mortgage
$77,500
Interest Rate
6.16%
Purchase Details
Closed on
Oct 26, 1994
Sold by
Lifestyle Development
Bought by
Nichols Scott J
Home Financials for this Owner
Home Financials are based on the most recent Mortgage that was taken out on this home.
Original Mortgage
$60,000
Interest Rate
9.21%
Create a Home Valuation Report for This Property
The Home Valuation Report is an in-depth analysis detailing your home's value as well as a comparison with similar homes in the area
Home Values in the Area
Average Home Value in this Area
Purchase History
| Date | Buyer | Sale Price | Title Company |
|---|---|---|---|
| Nichols Scott | -- | Accommodation | |
| Nichols Scott | -- | -- | |
| Nichols Scott | -- | Cuesta Title Company | |
| Nichols Scott J | -- | Cuesta Title Company | |
| Nichols Scott J | $68,500 | Chicago Title Insurance Co |
Source: Public Records
Mortgage History
| Date | Status | Borrower | Loan Amount |
|---|---|---|---|
| Previous Owner | Nichols Scott J | $77,500 | |
| Previous Owner | Nichols Scott J | $60,000 |
Source: Public Records
Tax History Compared to Growth
Tax History
| Year | Tax Paid | Tax Assessment Tax Assessment Total Assessment is a certain percentage of the fair market value that is determined by local assessors to be the total taxable value of land and additions on the property. | Land | Improvement |
|---|---|---|---|---|
| 2025 | $7,414 | $694,484 | $235,137 | $459,347 |
| 2024 | $7,324 | $680,868 | $230,527 | $450,341 |
| 2023 | $7,324 | $667,518 | $226,007 | $441,511 |
| 2022 | $5,545 | $498,548 | $221,576 | $276,972 |
| 2021 | $5,528 | $488,774 | $217,232 | $271,542 |
| 2020 | $5,463 | $483,763 | $215,005 | $268,758 |
| 2019 | $5,421 | $474,279 | $210,790 | $263,489 |
| 2018 | $5,354 | $464,980 | $206,657 | $258,323 |
| 2017 | $5,262 | $455,863 | $202,605 | $253,258 |
| 2016 | $4,977 | $446,926 | $198,633 | $248,293 |
| 2015 | $4,910 | $440,214 | $195,650 | $244,564 |
| 2014 | $4,735 | $431,592 | $191,818 | $239,774 |
Source: Public Records
Map
Nearby Homes
- 601 Vista Pacifica Cir
- 618 Vista Pacifica Cir
- 2 Paseo Ladera Ln
- 747 Vista Pacifica Cir
- 657 Vista Pacifica Cir
- 670 Vista Pacifica Cir
- 45 La Gaviota
- 762 White Oak Blvd
- 60 La Garza
- 234 Christine Way
- 1032 Margarita
- 201 Five Cities Dr Unit 100
- 108 Marian Way
- 834 N 5th St
- 170 Surf St
- 249 Margo Way
- 207 Princessa Ln
- 910 N 12th St
- 115 Fairview Ln
- 850 N 12th St
- 6 Paseo Ladera Ln
- 612 Shamrock Ln
- 616 Shamrock Ln
- 5 Paseo Ladera Ln
- 624 Shamrock Ln
- 625 Shamrock Ln
- 4 Paseo Ladera Ln
- 628 Shamrock Ln
- 3 Paseo Ladera Ln
- 629 Shamrock Ln
- 100 Irish Way
- 632 Shamrock Ln
- 104 Irish Way
- 633 Shamrock Ln
- 108 Irish Way
- 640 Shamrock Ln
- 637 Shamrock Ln
- 112 Irish Way
- 101 Irish Way