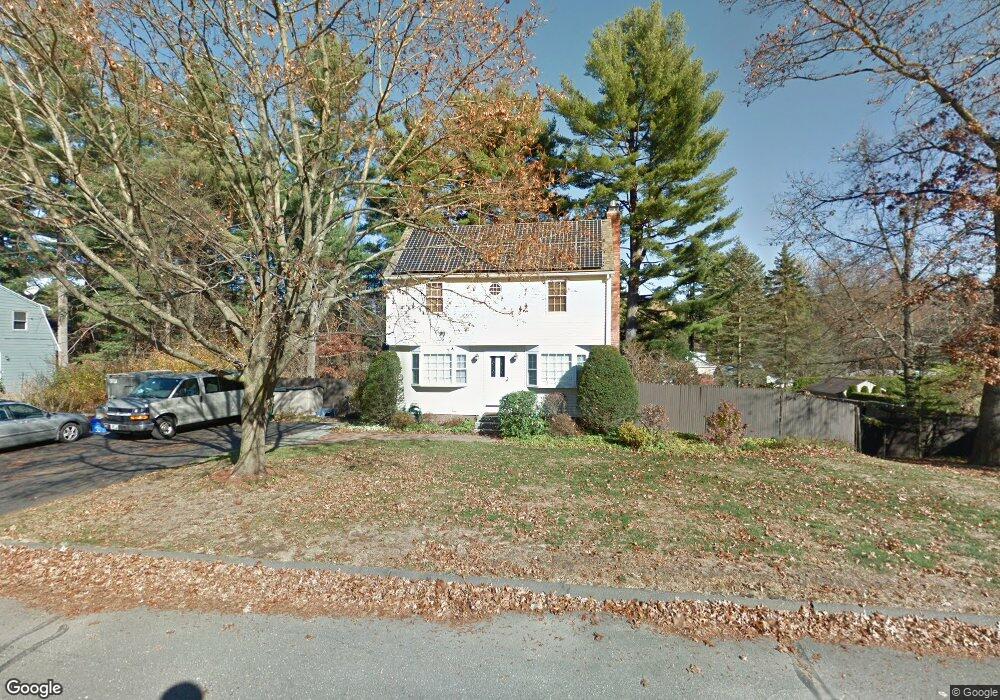
7 Picard Cir Easthampton, MA 01027
Estimated Value: $391,000 - $462,000
2
Beds
3
Baths
1,476
Sq Ft
$285/Sq Ft
Est. Value
About This Home
This home is located at 7 Picard Cir, Easthampton, MA 01027 and is currently estimated at $420,739, approximately $285 per square foot. 7 Picard Cir is a home located in Hampshire County with nearby schools including Easthampton High School, Hilltown Cooperative Charter Public School, and Calvary Baptist Christian School.
Ownership History
Date
Name
Owned For
Owner Type
Purchase Details
Closed on
Nov 15, 1989
Sold by
Dion Richard T
Bought by
Londraville Douglas
Current Estimated Value
Purchase Details
Closed on
Apr 10, 1987
Sold by
Gianchetti Gary
Bought by
Dion Richard T
Create a Home Valuation Report for This Property
The Home Valuation Report is an in-depth analysis detailing your home's value as well as a comparison with similar homes in the area
Home Values in the Area
Average Home Value in this Area
Purchase History
| Date | Buyer | Sale Price | Title Company |
|---|---|---|---|
| Londraville Douglas | $117,000 | -- | |
| Dion Richard T | $105,000 | -- |
Source: Public Records
Mortgage History
| Date | Status | Borrower | Loan Amount |
|---|---|---|---|
| Open | Dion Richard T | $70,000 | |
| Closed | Dion Richard T | $78,000 | |
| Closed | Dion Richard T | $91,200 |
Source: Public Records
Tax History Compared to Growth
Tax History
| Year | Tax Paid | Tax Assessment Tax Assessment Total Assessment is a certain percentage of the fair market value that is determined by local assessors to be the total taxable value of land and additions on the property. | Land | Improvement |
|---|---|---|---|---|
| 2025 | $5,219 | $381,800 | $120,900 | $260,900 |
| 2024 | $5,035 | $371,300 | $117,500 | $253,800 |
| 2023 | $3,966 | $270,700 | $92,500 | $178,200 |
| 2022 | $4,475 | $270,700 | $92,500 | $178,200 |
| 2021 | $4,913 | $280,100 | $92,500 | $187,600 |
| 2020 | $4,808 | $270,700 | $92,500 | $178,200 |
| 2019 | $4,128 | $267,000 | $92,500 | $174,500 |
| 2018 | $3,976 | $248,500 | $87,200 | $161,300 |
| 2017 | $3,881 | $239,400 | $83,800 | $155,600 |
| 2016 | $3,732 | $239,400 | $83,800 | $155,600 |
| 2015 | $3,627 | $239,400 | $83,800 | $155,600 |
Source: Public Records
Map
Nearby Homes